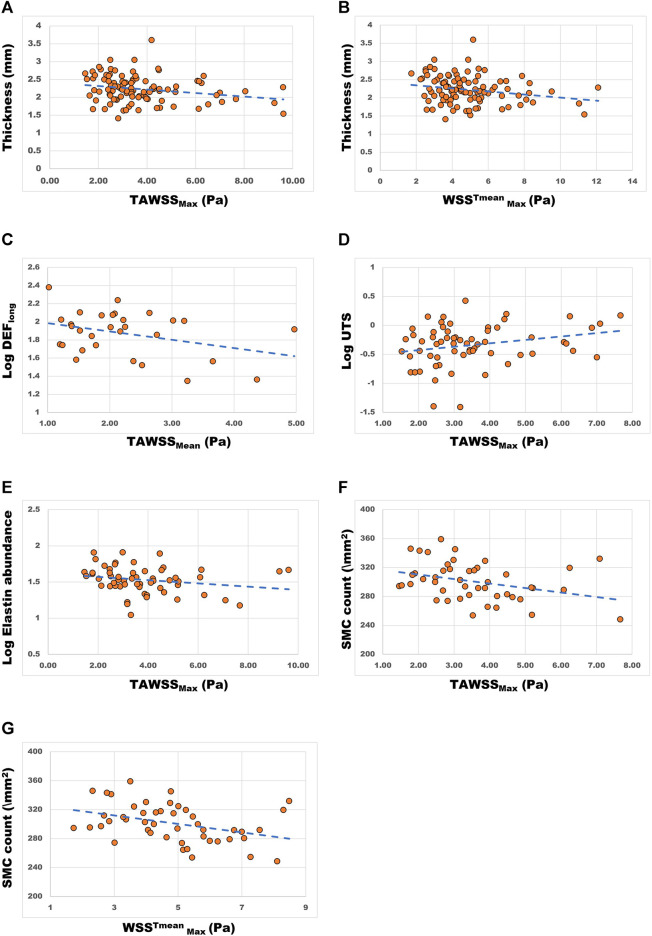
FIGURE 5.
Scatter plots and trendlines demonstrating the relationship between WSS parameters (x-axes) and aortic wall material properties. (A) aortic wall thickness (mm) vs TAWSSmax (Pa) and (B) WSSTmean Max (Pa); (C) longitudinal dissection energy function (log10 transformed, Log DEFlong) vs TAWSSmean (Pa); (D) ultimate tensile strength (log10 transformed, Log UTS) vs TAWSSmax (Pa); (E) Elastin abundance (log10 (90-x) transformed) vs TAWSSmax (Pa); (F) Smooth muscle cell (SMC) count (\mm2) vs TAWSSmax (Pa) and (G) WSSTmean Max (Pa).

