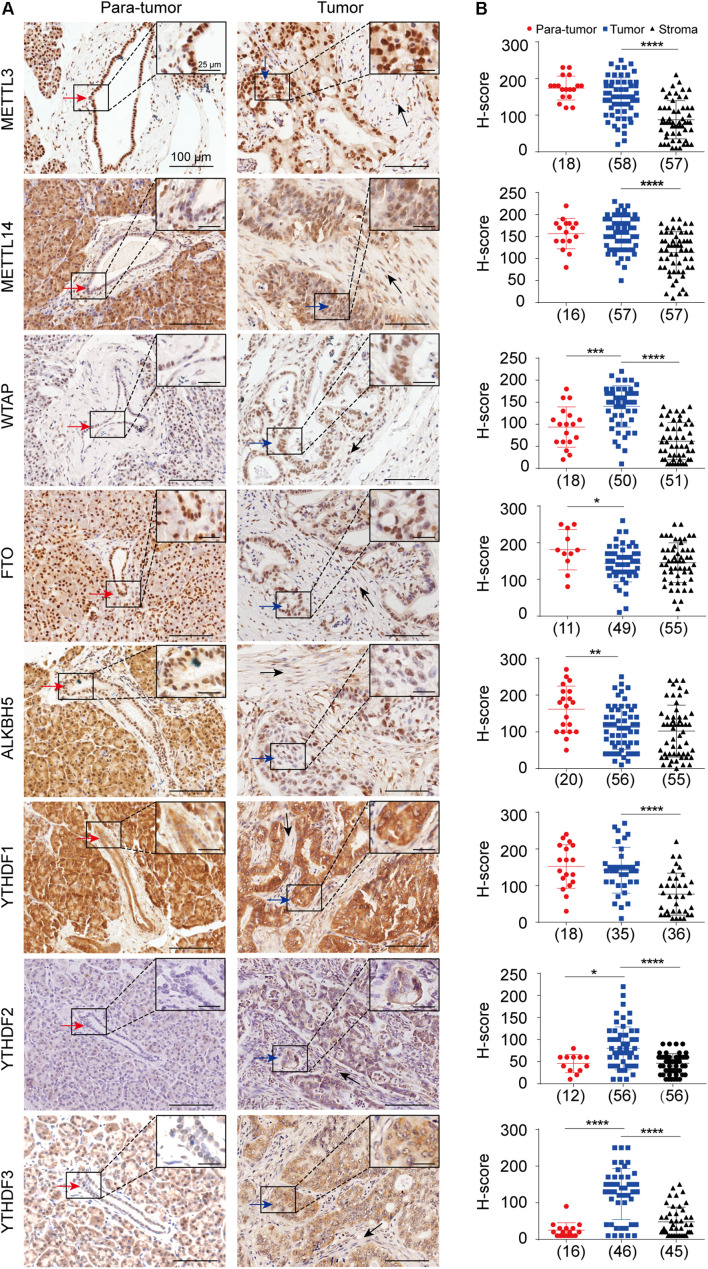
FIGURE 1.
In situ protein expression analysis of eight m6A key regulators in pancreatic ductal adenocarcinoma (PDAC). (A) Representative immuno-histochemical staining showing the expressions of METTL3, METTL14, WTAP, FTO, ALKBH5, and YTHDF1-3 in normal pancreatic ductal epithelial cells (red arrows) in para-tumor samples, tumor cells (blue arrows), and stromal cells (black arrows) in tumor samples. Enlarged images in the box are shown in the upper right. (B) Scatter plots showing the H-scores of each gene in para-tumor, tumor and stroma cells are shown in the right panel. Case numbers are shown in brackets. Scale bars, 100 or 25 μm. *P < 0.05, **P < 0.01, ***P < 0.001, ****P < 0.0001.

