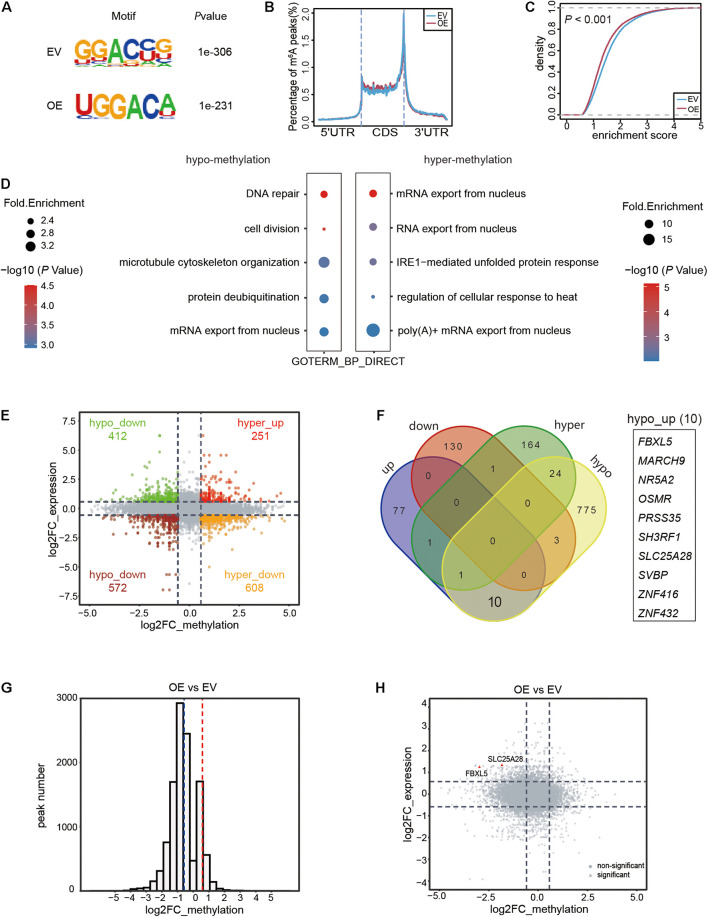
FIGURE 3.
Transcriptome-wide RNA m6A methylation and expression analysis of MIA PaCa-2 stable cell line with ALKBH5 overexpression. (A) Top consensus motif of m6A peaks identified in empty vector (EV) or ALKBH5-overexpressing (OE) MIA PaCa-2 cells. (B) Normalized distribution of m6A peaks across 5′UTR, CDS, and 3′UTR of mRNAs. (C) Cumulative distribution function of log2 enrichment score of m6A modified sites. (D) GO term analysis of transcripts with hypo- (left panel) and hyper-methylated (right panel) m6A sites in OE sample versus EV sample. (E) Scatter plot representing the log2FC of methylation (x-axis) and expression (y-axis) of each m6A peak in OE versus EV sample. Points with |log2FC| > 0.58 in both differential expression and methylation analysis results are highlighted. (F) Venn diagram showing the RNAs with significant change in either methylation (|log2FC| > 0.58 and FDR < 0.05) or expression (|log2FC| > 0.58 and P < 0.05) in OE sample. (G) Histogram showing the fold changes in m6A enrichment between OE and EV samples from total RNA based m6A data. Dotted lines denote the threshold (|log2FC| > 0.58) for filtering differential expression gene. (H) Scatter plot showing the distribution of fold changes in methylation (x-axis) and expression (y-axis) of each RNA in OE versus EV sample. Two RNAs with significantly decreased m6A methylation and increased expression level in OE sample are marked in red. Points in rectangle shape represent significant changes in methylation (|log2FC| > 0.58 and FDR < 0.05) and expression (|log2FC| > 0.58, P < 0.05), while the rest ones are shaped in circle.

