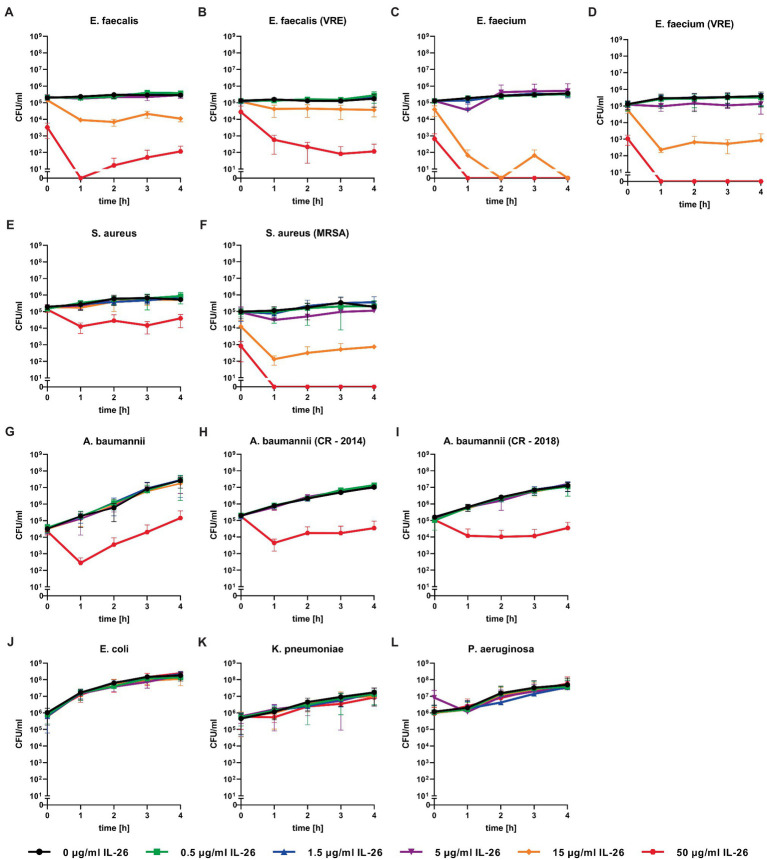
Figure 2.
Number of colony forming units per ml of different bacteria over 4h incubation at different IL-26 concentrations. Panels (A-F) show IL-26 sensitive Gram-positive strains, panels (G-I) show IL-26 sensitive Gram-negative strains, and panels (J-L) show IL-26-resistant Gram-negative strains. Data are given as mean with standard deviation, for each strain n=3. CFU, colony-forming units; VRE, vancomycin-resistant Enterococcus; MRSA, methicillin-resistant S. aureus; and CR, carbapenem resistant.

