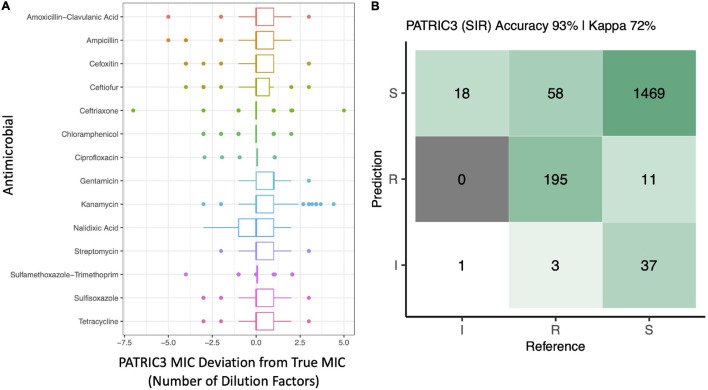
FIGURE 3.
(A) Deviation of PATRIC3 predicted minimum inhibitory concentration (MIC) values from “true” MIC values obtained using phenotypic resistance testing for 14 antimicrobials (Y-axis), reported in number of dilution factors (X-axis). For each box plot, lower and upper box hinges correspond to the first and third quartiles, respectively. Lower and upper whiskers extend from the hinge to the smallest and largest values no more distant than 1.5 times the interquartile range from the hinge, respectively. Points represent pairwise distances that fall beyond the ends of the whiskers. Only isolates with raw MIC values available are included (126 of 128 isolates). (B) Confusion matrix showcasing agreement between susceptible-intermediate-resistant (SIR) classification of all 128 Salmonella isolates obtained using phenotypic resistance testing (denoted as the matrix “Reference”) and PATRIC3 (denoted as the matrix “Prediction”) for 14 antimicrobials. The accuracy value above the matrix denotes the percentage of correctly classified instances out of all instances. The Kappa value above the matrix denotes Cohen’s kappa coefficient for the matrix, reported as a percent. For both the phenotypic and PATRIC3 methods, SIR classification was determined using NARMS breakpoints for Salmonella (accessed March 23, 2020).

