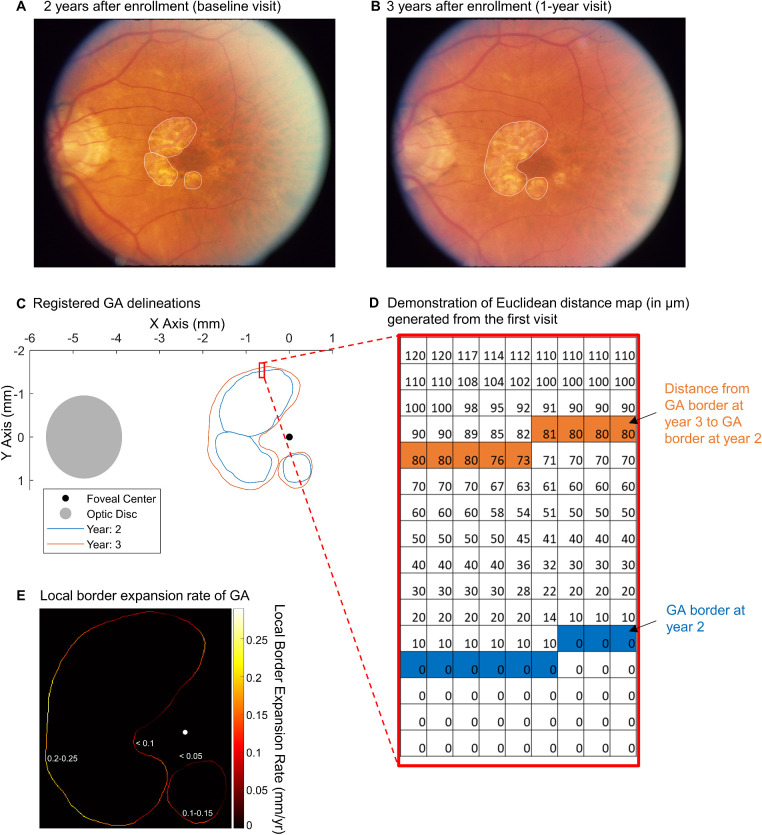
Figure 1.
Demonstration of local GA BER. (A) Color fundus photograph of an eye 2 years after enrollment in the AREDS. We considered this visit to be the baseline visit of the eye in the present study. The white lines represent manually delineated GA borders. (B) The same eye 1 year later (i.e., 1-year visit). (C) Delineation of the GA border from the two visits was registered based on three points at vessel bifurcations and shown in a coordinate system centered at the fovea. (D) A matrix showing a part of the Euclidean distance map generated based on GA at the baseline visit (year 2 after enrollment). The blue pixels represent the GA border at the baseline visit. The value in each pixel (pixel width = 10 µm) of the Euclidean distance map indicates the shortest distance from this pixel to the GA at the baseline visit. Orange pixels represent the GA border at the 1-year visit. The value in each orange pixel represents the shortest distance from the GA border at the 1-year visit to the GA border at the baseline visit (i.e., local GA BER). (E) Based on the Euclidean distance map, we determined the local GA BERs (mm/y) at each pixel of the GA border at the 1-year visit (demonstrated in the heatmap). Note that the BERs were consistently below 0.1 mm/y along the GA border closer to the fovea and increased at distances farther from the fovea (see values marked on the heatmap). We calculated eye-specific BERs as the mean of local BERs of all pixels on the GA border in each eye over 1 year.

