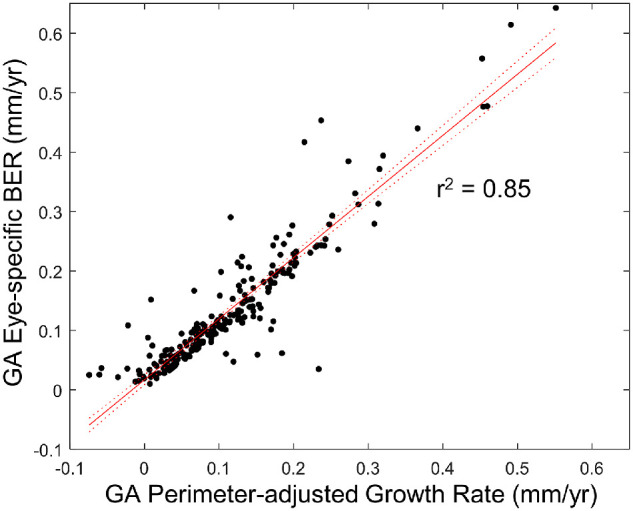
Figure 5.

Eye-specific GA BERs were strongly associated with GA perimeter-adjusted growth rates. Both parameters were calculated based on visits spaced over 1 year in 237 eyes. The eye-specific BER was calculated as the mean local BERs of all pixels on the GA border over 1 year using the Euclidean distance map (Fig. 1). We calculated the GA perimeter-adjusted growth rate as (Total GA area at year 1 – total GA area at year 0)/(Mean GA perimeter between first and second visits). Both parameters reflect the mean expansion rate of the leading edge of GA (Supplementary Fig. S6), although they were measured differently. The strong association between the two parameters (r2 = 0.85; P < 0.001) indicates that the two parameters are equivalent for eyes with a relatively short follow-up duration (e.g., 1 year).
