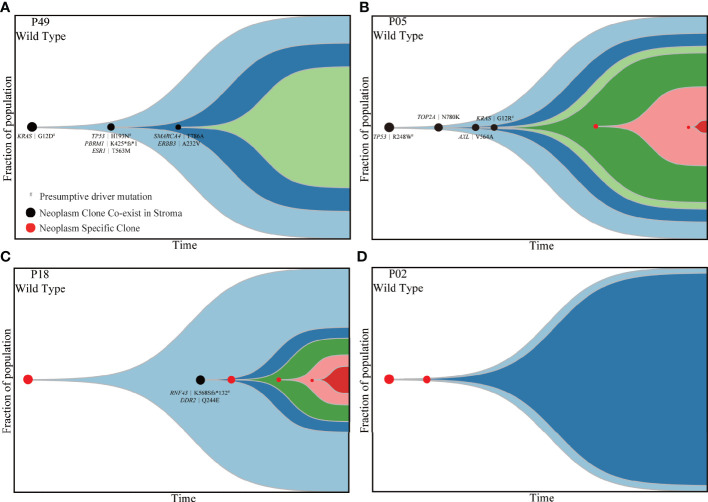
Figure 4.
Four types of patients demonstrating different evolutionary trajectories involving both stroma and neoplastic components. P49 (A), P05 (B), P18 (C) and P02 (D) presented four different subtypes of evolutionary trajectory. The black dots indicate clones shared by matched stroma and neoplasm. The red dots represent clones private to neoplastic components. The black characters indicate mutations shared by matched stromal and neoplastic components. The emergence and progression pattern of each clone are hypothesized according to the fraction of clonal population inferred from the average VAF of mutations involved in the same clone. VAF, variant allele frequency.

