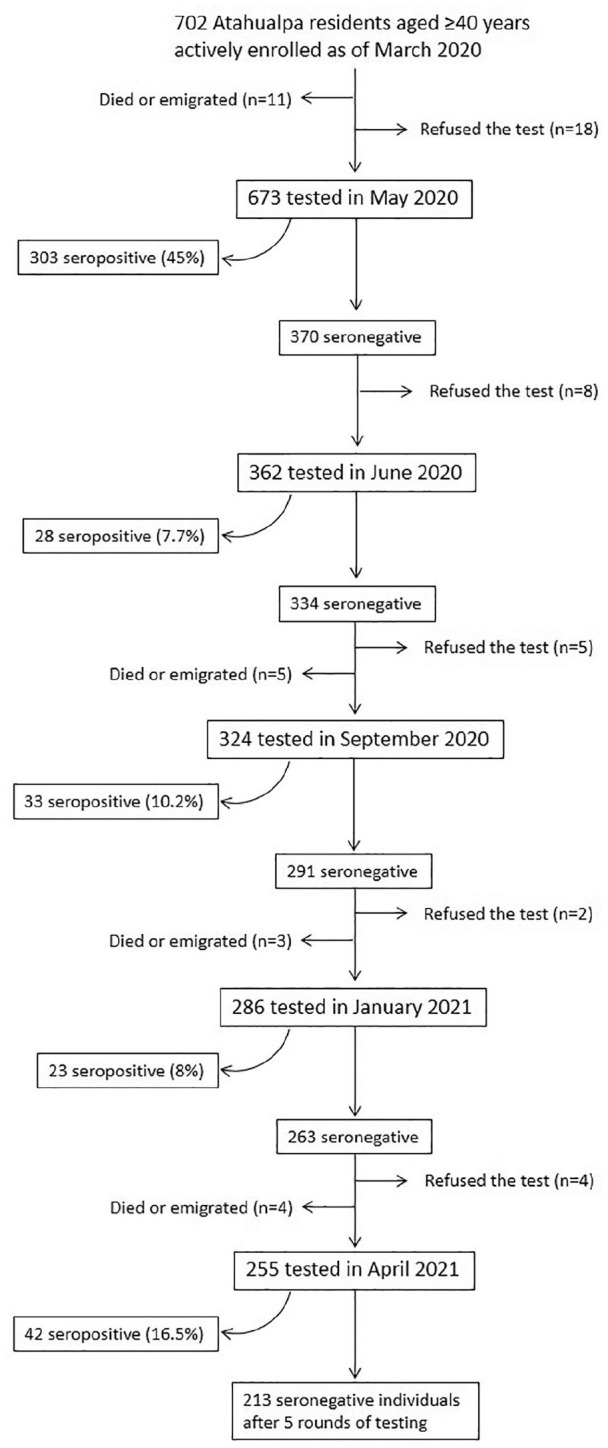
Figure 1.

Flow chart depicting the reasons for censoring individuals before the end of the study and the number of persistent seronegative individuals at the administrative censoring date (April, 2021).

Flow chart depicting the reasons for censoring individuals before the end of the study and the number of persistent seronegative individuals at the administrative censoring date (April, 2021).