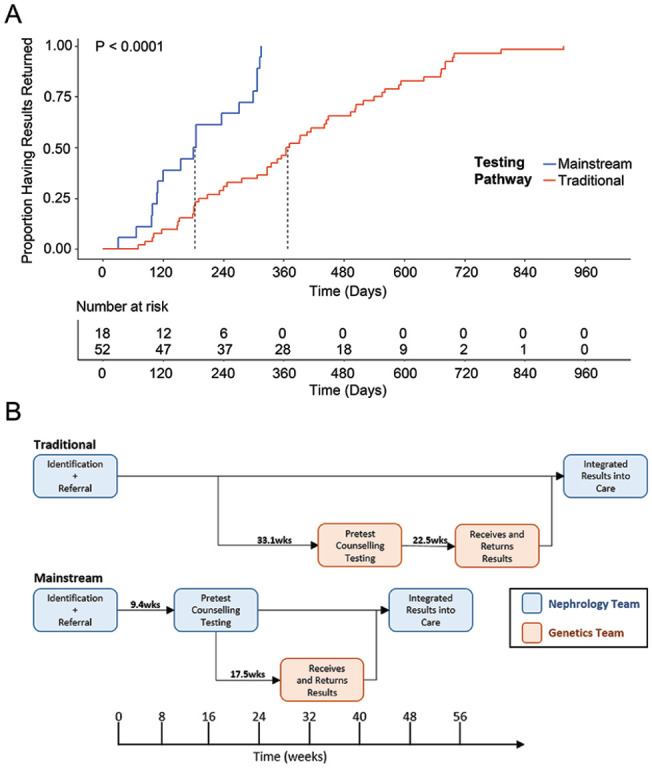
Figure 3.

Comparison of turnaround time for results and diagnostic rates for the mainstream pathway to current standards. (A) Time to return of genetic results with median denoted for traditional and mainstream testing pathways. P-value per log-rank test. (B) Temporal schematic of specific actions that occur within each pathway with times between steps noted in weeks.
