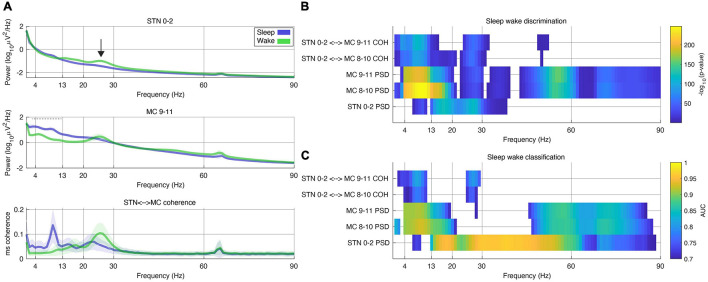
FIGURE 3.
Frequencies discriminating between sleep and wake states during a period of 24 h in a single subject. (A) Power spectral density (PSD) plots of sleep and wake hours. These PSD data were computed from 30 s segments of field potentials classified by patient motor diary. Stimulation was held constant. Top plot – field potential from STN (subthalamic nucleus) contacts 0–2 (stimulation was constant at 2.7 mA on contact C + 1–). Middle plot – MC (motor cortex) contact 9–11. Bottom plot – magnitude squared (ms) coherence. In all plots shaded bars represent 0.5*standard deviation of segments. Black arrow (top plot) represents beta band activity that is commonly used as a marker of PD medication state and potential biomarker. Note decrease in beta band activity during sleep. Dashed horizontal gray bay in middle plot (MC 9–11) represents band used for sleep classification in this patient (Table 1). (B) Color plot of -log10 of individual p-values computed from t-tests across all bipolar recording contacts (higher values represent smaller p-values). Only frequency bins in which significant differences were found between sleep or wake states are displayed (the equivalent of a Bonferroni corrected value of p = 0.05 on this scale is 4). Each row represents PSDs (power spectral density) from motor cortex (MC), STN (subthalamic nucleus) or ms-coherence between the two. (C) Same data used in (B) was used to assess the out-of-sample classification with the area under the curve (AUC) computed using the ROC (receiver operating characteristic) curve. Plot was thresholded at an AUC of 0.7 (only higher scores shown).

