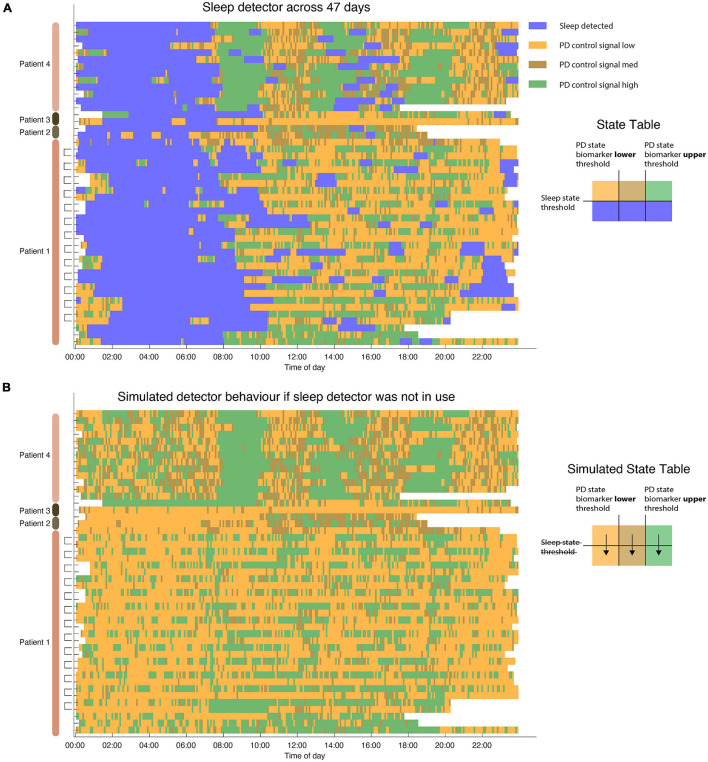
FIGURE 4.
Sleep detector performance across 47 days of sleep. (A) Dual detector states across 4 patients in 6 hemispheres. Each row represents a single 24 h period. Note that in patient 1 each hemisphere was running independently (measuring sleep states using L/R hemispheres, respectively). Detector traces from the same day (coming from two different pulse generators) are indicated in brackets. Sleep is not only identified during night hours but also occurs in some patients during daytime naps. (B) Simulated state table showcase PD state detector state if sleep detector was not in place during same hours. Without relying on a dedicated sleep detector PD state control signal still undergoes many state changes during sleep hours. Blank (white) periods indicate moments in which the detector was not active or data do not exist.

