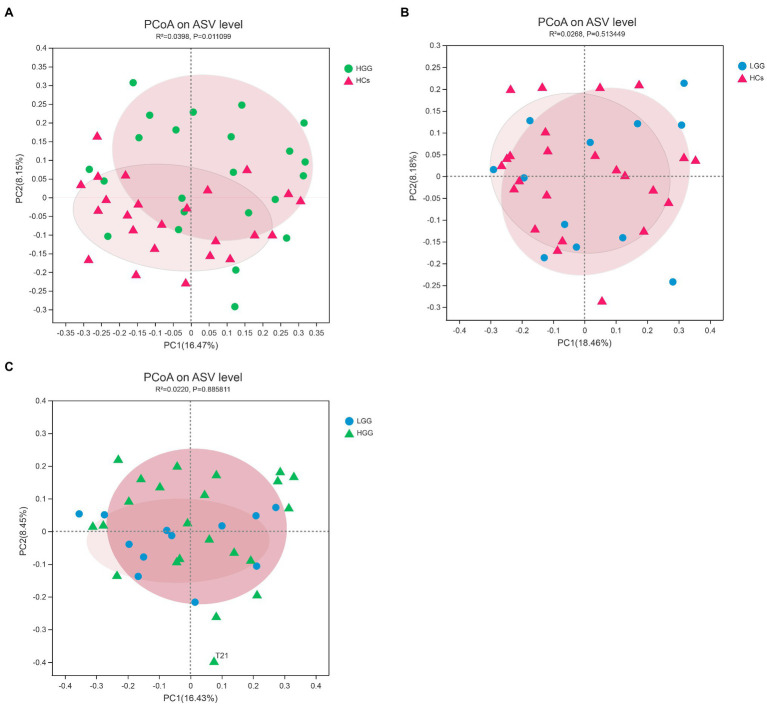
Figure 1.
Principal component analysis (PCoA) plots based on the Bray-Curtis distances showed distinct clusters in (A) HCs&HGG, (B) HCs&LGG, and (C) HGG&LGG. The individual samples are color-coded to indicate HCs (red), LGG (blue), and HGG (green). HCs, healthy controls; HGG, high-grade glioma; LGG, low-grade glioma.

