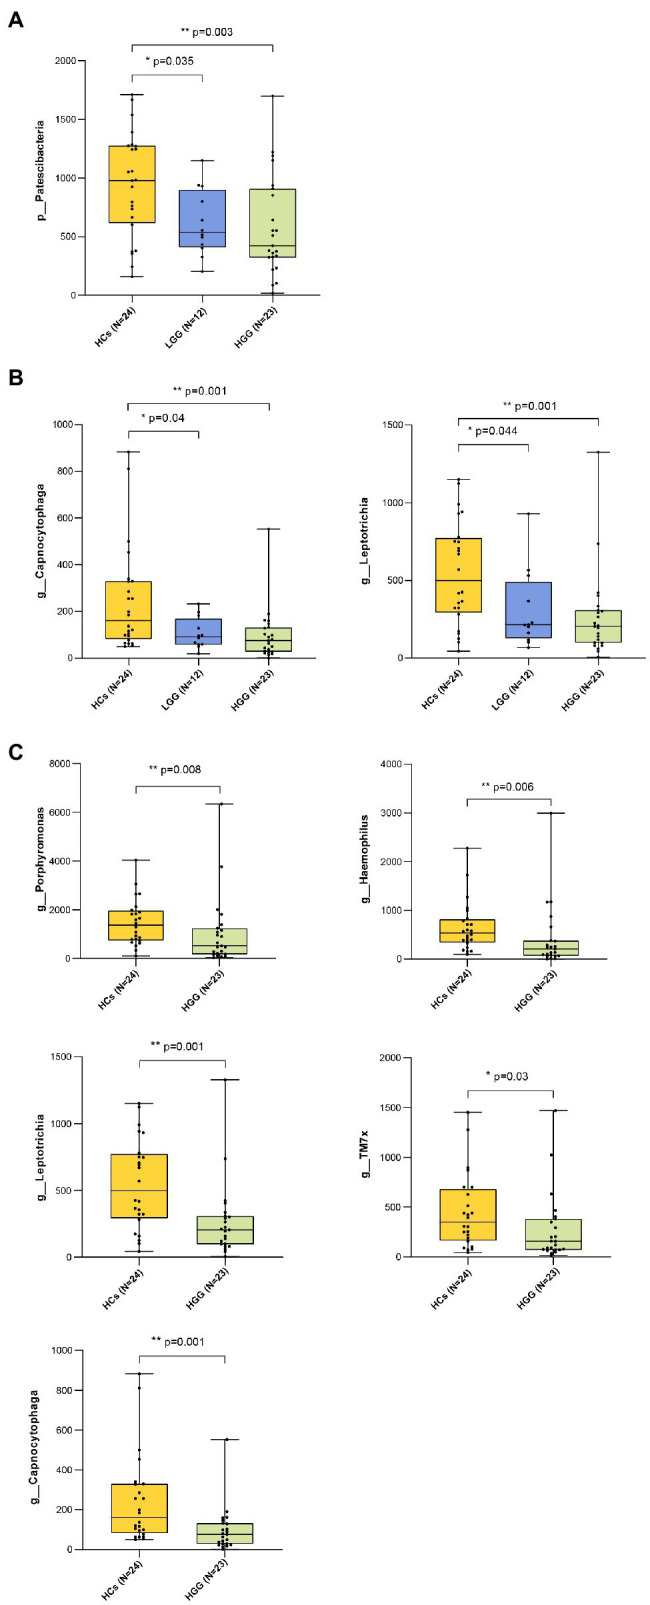
Figure 3.

Bacteria taxonomic profiling of oral microbiome from healthy controls and glioma patients. (A) Relative abundance of the pylum Patescibacteria in HCs, LGG, and HGG; (B) relative abundance of genera Capnocytophaga and Leptotrichia in HCs, LGG, and HGG; FIGURE 3(C) relative abundance of genera Porphyromonas, Haemophilus, Leptotrichia, TM7x, Capnocytophaga in HCs, and HGG. The box plot represented the relative abundance of bacteria genus in HCS, LGG, and HGG. The p value was calculated by non-parametric Mann-Whitney U test. Each box plot represents the median, interquartile range, minimum, and maximum values. p value <0.05 indicated the statistical significance. HCs, healthy controls; LGG, low-grade glioma; HGG, high-grade glioma.
