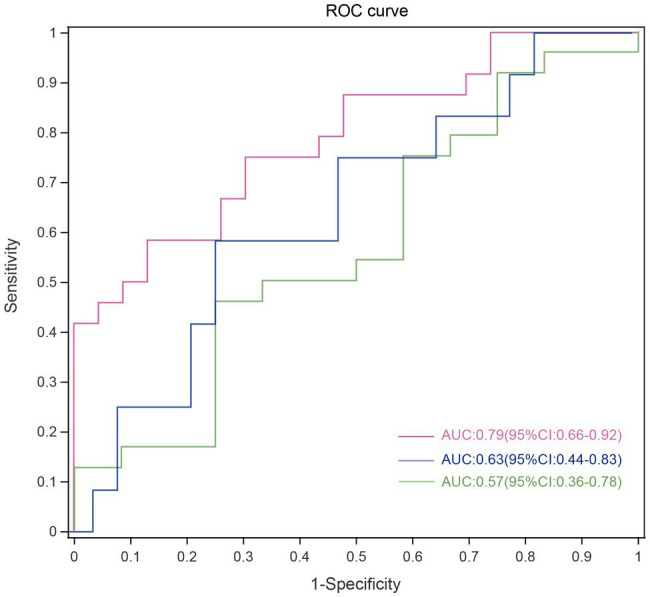
Figure 4.

Disease malignancy based on oral microbiome signature. ROC curves evaluating ability to predict tumor malignancy patients based on 5 significantly altered genera. Each curve represents the sensitivity and specificity to distinguish subjects with HGG (red line), LGG (green line) from HCs, while the blue line represents sensitivity and specificity between LGG and HGG. ROC, receiver operating characteristic; HGG, high-grade glioma; LGG, low-grade glioma; HCs, healthy controls.
