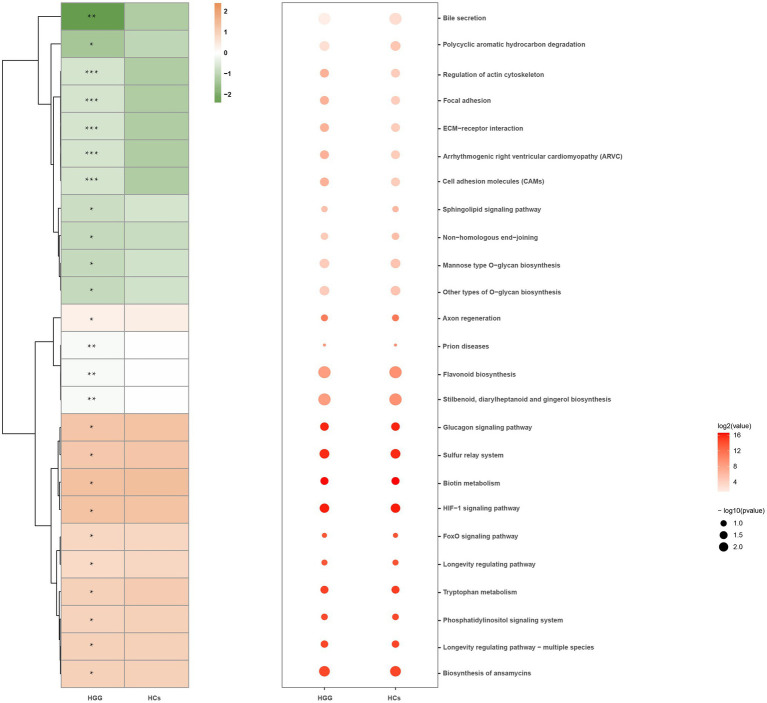
Figure 5.
Microbial functions altered in the HCs and HGG. Heat map showing the medial abundance of all significant modules as determined by PICRUSt analysis at HCs and HGG. * p<0.05, **p<0.01, ***p<0.001. PICRUSt, Phylogenetic Investigation of Communities by Reconstruction of Unobserved States; HCs, healthy controls; HGG, high-grade glioma.

