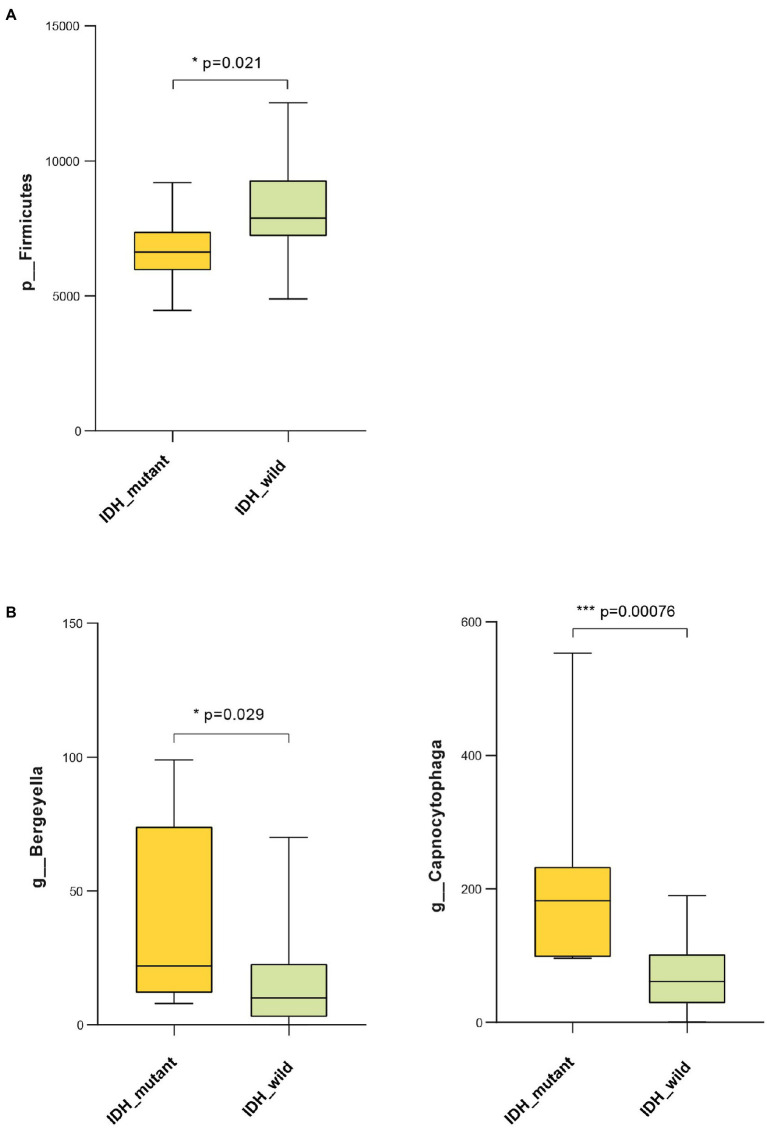
Figure 6.
Bacteria taxonomic profiling of oral microbiome from IDH1-mutant group and IDH1-wild group. (A) Relative abundance of phylum Proteobacteria in IDH1-mutant group and IDH1-wild group; (B) relative abundance of genera Bergeyella and Capnocytophaga in IDH1-mutant group and IDH1-wild group. Cross coordinates represent different group names and longitudinal represent the abundance of a species in different groups. The p value was calculated by non-parametric Mann-Whitney U test. Each box plot represents the median, interquartile range, minimum, and maximum values. IDH1, isocitrate dehydrogenase 1.

