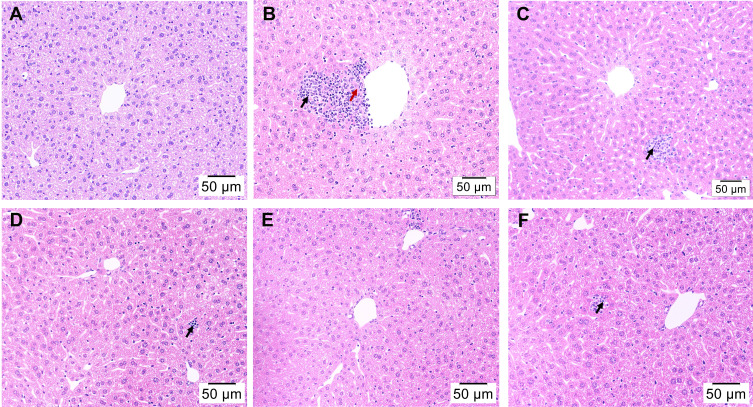
Figure 4.
Effect of H2 on liver histopathological alterations in mice injured by D-Gal (H&E staining, magnification 200×). (A) Control group, (B) Model group, (C) 4% H2 group, (D) HRW group, (E) HRS group, and (F) Ator group. Black arrows indicate inflammatory cell infiltration and red arrow indicates necrosis.

