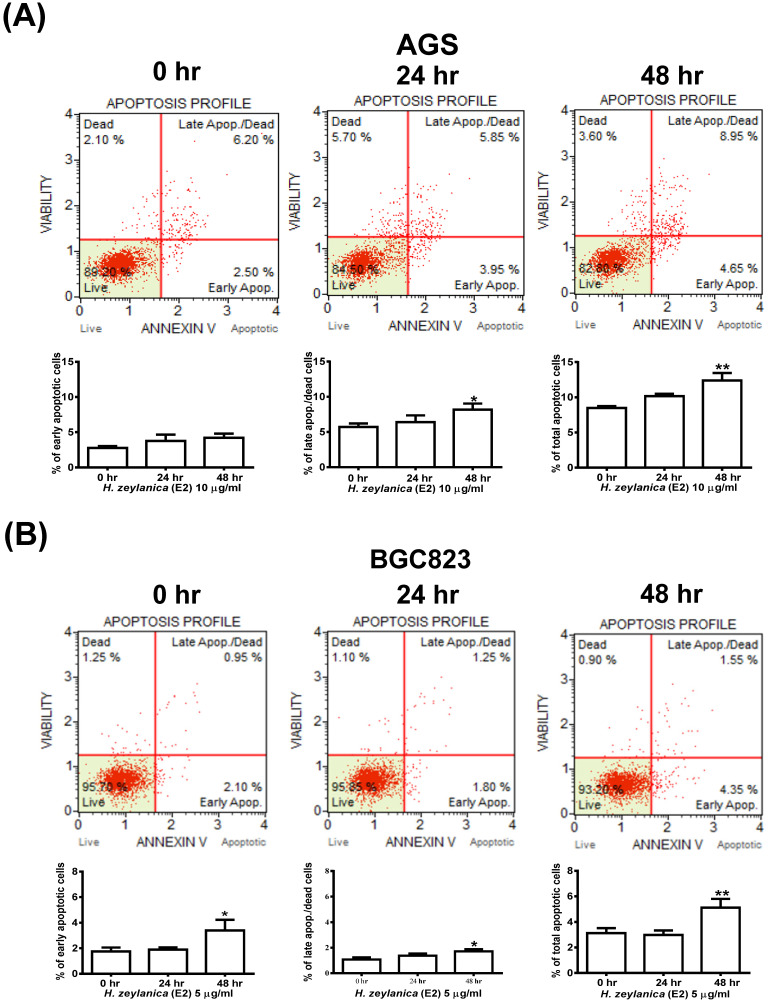
Figure 2.
Effects of H. zeylanica-E2 on GC cell apoptosis. (A) AGS cells were treated with H. zeylanica-E2 (10 μg/mL), and (B) BGC823 cells were treated with H. zeylanica-E2 (5 μg/mL) for 0, 24, or 48 h. The cells from different experimental groups were collected and incubated with Muse™ Annexin V & Dead Cell reagent (Merck Millipore, Billerica, MA, USA) for 20 min at room temperature and then analyzed using a MuseTM Cell Analyzer (Merck). Four populations of cells (live, early apoptotic, late apoptotic, and dead) were quantified. The upper left shows mostly nuclear debris: Annexin V- and 7-AAD+; lower left shows nonapoptotic cells: Annexin V- and 7-AAD-; lower right shows early apoptotic cells: Annexin V+ and 7-AAD-; and the upper right shows late-stage apoptotic and dead cells: Annexin V+ and 7-AAD+. The figures below (A, B) are the quantitative results. Data are presented as mean ± SEM of at least three independent experiments. Student's-t-test or one-way ANOVA was used for comparison with the control values. (**p < 0.01, *p < 0.05).

