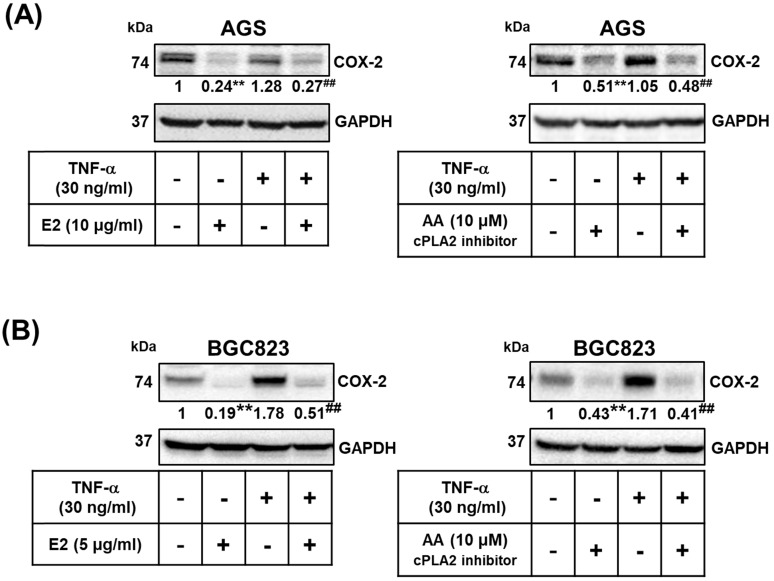
Figure 7.
Role of cPLA2 in the effects of H. zeylanica-E2 on TNF-α-induced COX-2 expression. (A) AGS cells were pretreated with or without H. zeylanica-E2 (left) or AA (right) and then incubated with TNF‐α for 24 h. (B) BGC823 cells were pretreated with H. zeylanica-E2 (left) or AA (right) and then stimulated with TNF‐α for 24 h. The COX-2 protein level was determined by Western blotting. GAPDH was used as a loading control. The expression level of COX-2 was quantified according to the position of the electrophoresis band. The results are expressed as the quantified value for COX-2 divided by that of GAPDH. Data are presented as mean ± SEM of three independent experiments. Student's-t-test or one-way ANOVA was used for comparison with the control. (#p < 0.05, ##p < 0.01 compared with the TNF‐α-stimulated group; *p < 0.05, **p < 0.01 compared with the control).

