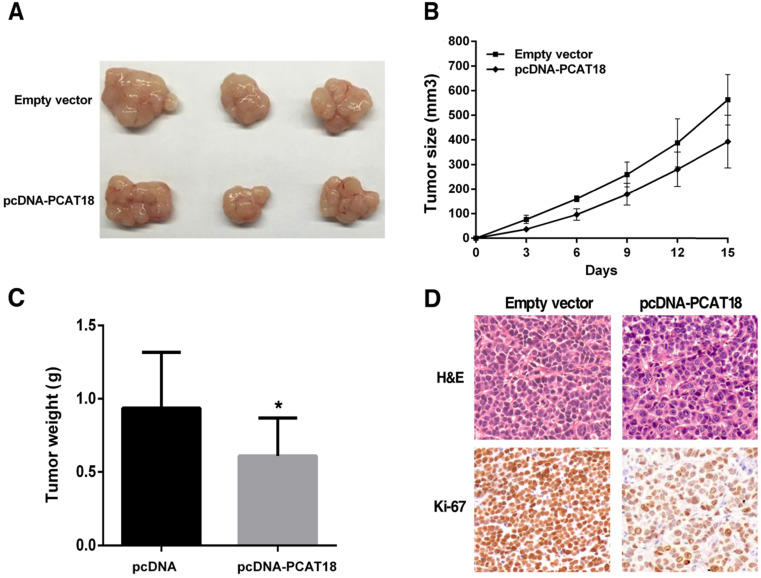
Figure 5.
The influence of PCAT18 on tumorigenesis in vivo. A, B. pcDNA-PCAT18 or empty vector was first transfected into the 7901 cells, before injecting into the nude mice (n=3). Each two days after the injection, the tumor volumes were measured. The bars represent the SD. C. The weight of the tumors is depicted as mean ± SD (n=3). D. The tumor portions underwent IHC and H&E staining by an antibody opposing Ki-67. *P < 0.05.

