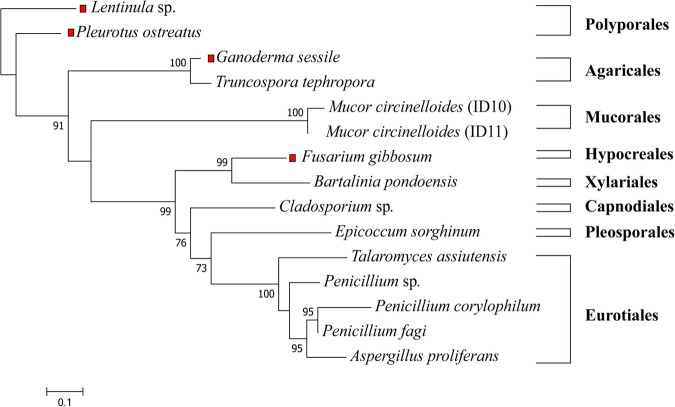
FIGURE 1.
Maximum likelihood tree of all tested fungi in this study. The ITS1-5.8S-ITS2 sequences were aligned with MAFFT, the phylogenetic tree was generated with FastTree using a GTR + G + I model and visualized with MEGA X. Bootstrap values are indicated on the nodes. The red squares represent terrestrial fungi that were not derived from E. radiata. The scale represents the sequence divergence between the number of nucleotide substitutions per site.

