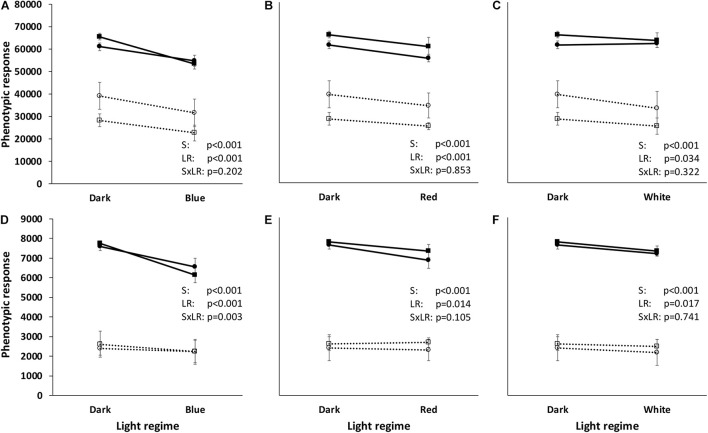
FIGURE 3.
Reaction norms of two Gram-negative (Pseudomonas agarici: black line, black-filled circles; Pseudomonas sp. DR 5-09: black line, black-filled squares) and two Gram-positive (Bacillus thuringiensis serovar israeliensis: black broken line, black-open circles; Streptomyces griseoviridis: black broken line, black-open squares) bacteria when exposed to different light regimes. The reaction norms are based on the phenotypic response to all 384 test substrates (A–C) and 37 test substrates (“co-catabolic subset”) (D–F) extracted from phenotypic microarrays using PM01-PM04 (Biolog, Haywood CA, United States). Total utilization was assessed by kinetic measurements of color change in the redox dye tetrazolium blue and calculated on the basis of maximum curve height (Omnilog units). Each value point corresponds to six independent replicates. Statistical information is based on ANOVA (general linear model) followed by Tukey’s test (p < 0.05) with respect to strain (S), light regime (LR), and their interaction (SxLR).

