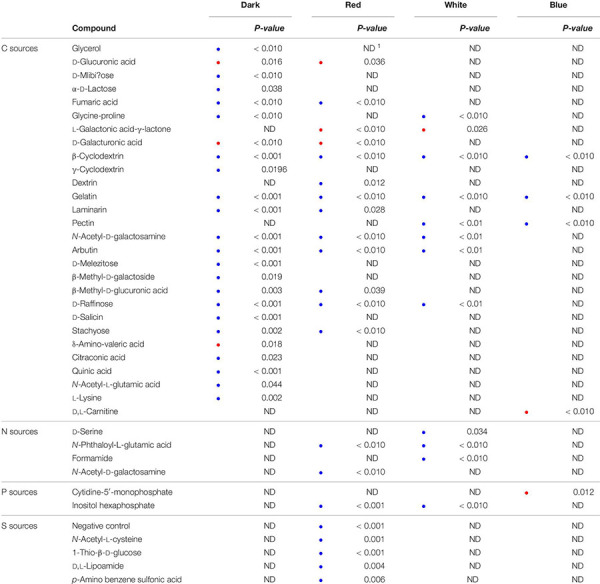
TABLE 2.
Comparison of substrate utilization by the control strain and Pseudomonas agarici, analyzed by T-test based on six individual replicates.

|
Substrates and p-values are displayed. Blue dots denote significantly higher respiration by the control strain, red dots higher utilization by P. agarici. 1Absence of significant differences is marked as no difference (ND).
