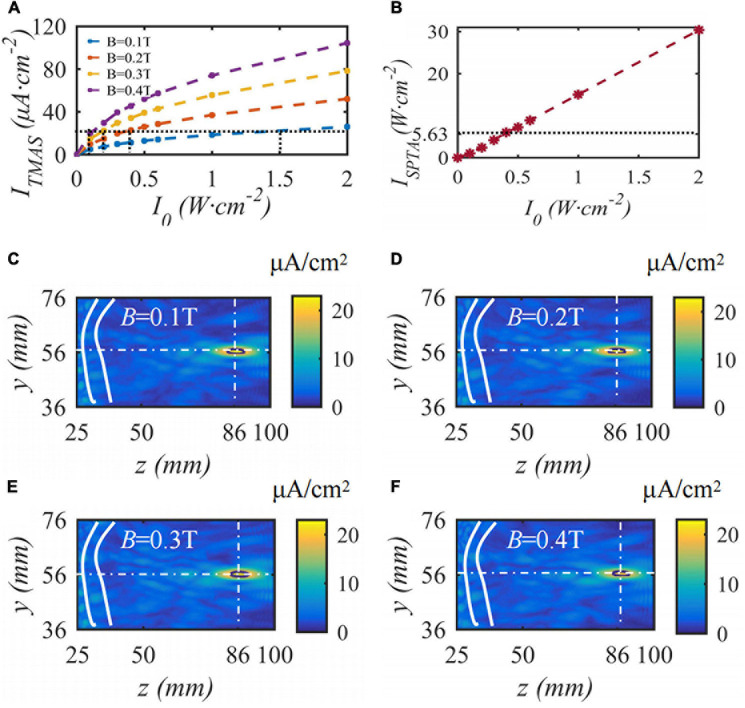
FIGURE 11.
The distribution of induced current density under different static magnetic field strengths, (A) is the change curve of induced current density with the input sound intensity, (B) is the spatial peak time-averaged sound intensity variation curve with output sound intensity, (C–F) are the distribution of induced current density (J = 22.3 μA⋅cm– 2, t = 10 s).

