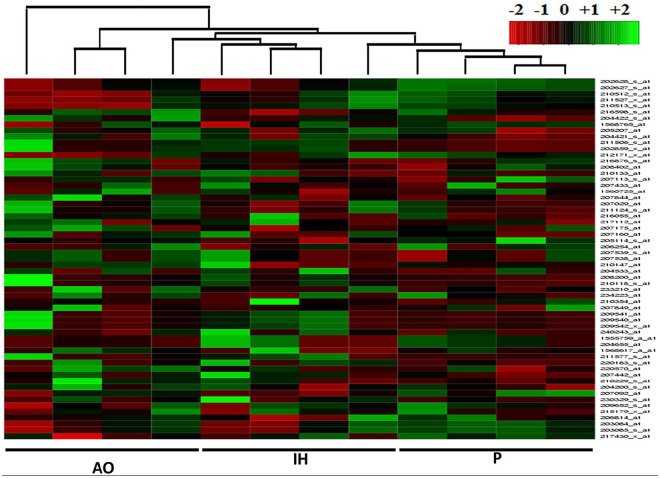
Figure 4.
Heatmap generation (ArrayMining) showing specific oxygen environment clustering. Individual columns represent hMSC expression profile from within specified condition; AO, IH, or P. Labelling convention is upregulation (green), no change (black), and down-regulation (red). The dendrogram indicates unsupervised clustering across the sample dataset used to generate the heatmap and expression data.

