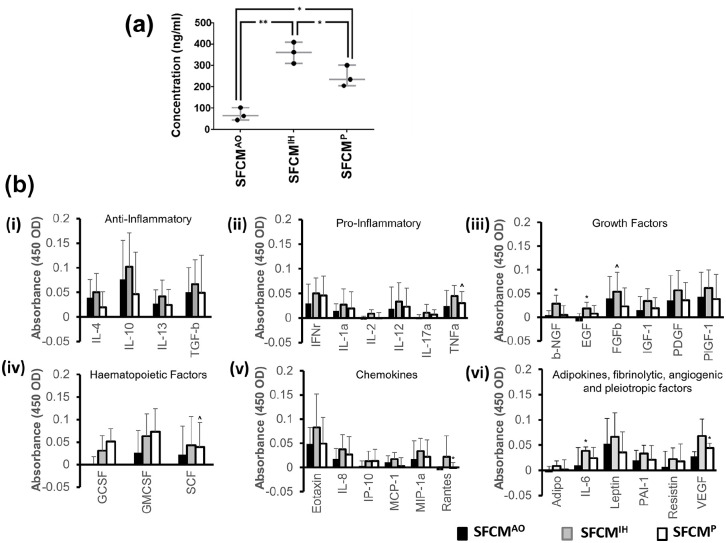
Figure 5.
Proteomic assessment of hMSC secretome. (a) Total protein content of SFCM was evaluated in AO, IH, and P cultured hMSCs via the Smith assay. Protein concentration is plotted on the y-axis whilst oxygen environment is indicated along the x-axis. Data expressed as mean ± SD, *p < 0.05 and **p < 0.001 (n = 3). (b) Colorimetric cytokine array of SFCM expressed as mean ± SD. The 31 bioactive factors were sub-classified into nine functional groups: (i) anti-inflammatory (IL4, IL10, IL13, and TGFb), (ii) pro-inflammatory (TNFa, IFNr, IL1a, IL2, IL12, and IL17a), (iii) growth factors (EGF, IGF1, bNGF, PIGF1, PDGF, and FGFb), (iv) haematopoietic factors (GCSF, GMCSF, and SCF), (v) chemokines (MIP1a, MCP1, Rantes, Eotaxin, IL8, and IP10) and (vi) adipokines (Resistin, Leptin, and Adiponectin), fibrinolytic factor (PAI1), angiogenic factor (VEGF), pleiotropic factor (IL6). Bioactive molecule tested is indicated along the x-axis and colorimetric absorbance plotted on the y-axis. AO, IH, and P are indicated by black, gray and white bars respectively. *indicates p < 0.05 versus AO, ^ indicates p < 0.05 versus IH (n = 4).

