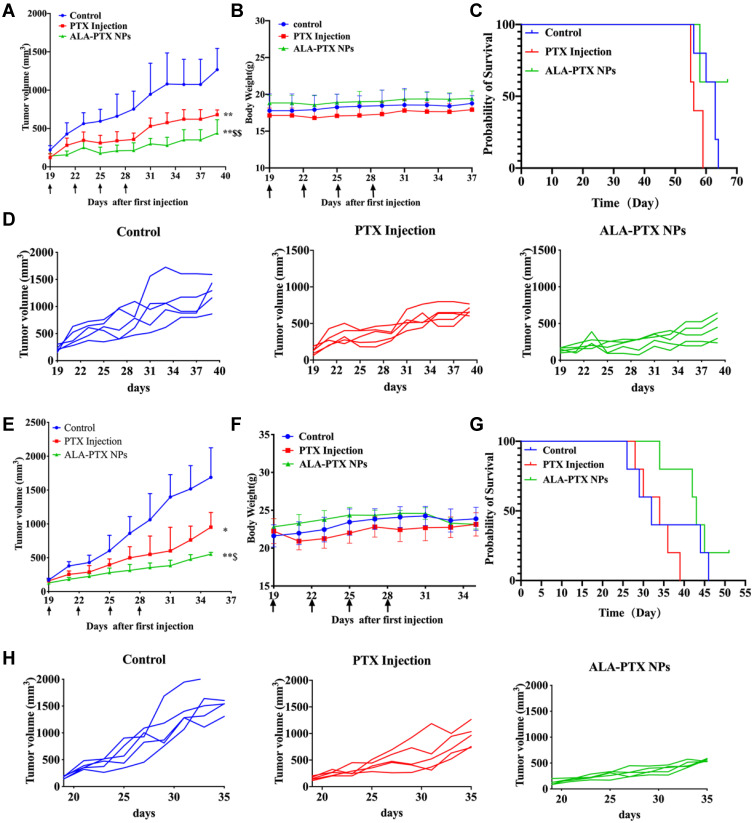
Figure 6.
In vivo antitumor activity of ALA-PTX NPs in MCF-7/ADR cell tumor- and HepG2 cell tumor-bearing BALB/c-nude mice treated with 5% glucose injection, PTX injection (10 mg/kg of PTX, iv, q3d × 4) or ALA-PTX NPs (40 mg/kg of ALA-PTX, iv, q3d × 4). (A) Tumor growth curve during treatments of MCF-7/ADR tumor-bearing BALB/c-nude mice. (B) Body weight of MCF-7/ADR tumor-bearing BALB/c-nude mice during treatment. (C) Survival curves of MCF-7/ADR tumor-bearing BALB/c-nude mice. (D) Individual tumor growth curve of MCF-7/ADR tumor-bearing BALB/c-nude mice. (E) Tumor growth curve during the treatments of HepG2 tumor-bearing BALB/c-nude mice. (F) Body weight of HepG2 tumor-bearing BALB/c-nude mice during treatment. (G) Survival curves of HepG2 tumor-bearing BALB/c-nude mice. (H) Individual tumor growth curve of HepG2 tumor-bearing BALB/c-nude mice. *p<0.05, **p<0.01, compared with the control group; $p<0.05, $$p<0.01, compared with the PTX injection group.

