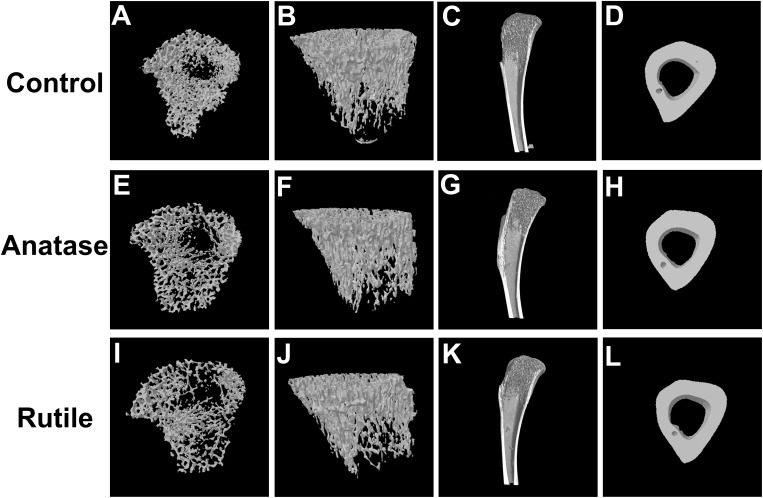
Figure 5.
Three-dimensional images of tibia. (A) Cross-sectional image of trabecular bone in the control group. (B) Overall image of trabecular bone in the control group. (C) Sagittal image of bone in the control group. (D) Cross-sectional image of cortical bone in the control group. (E) Cross-sectional image of trabecular bone in the anatase TiO2 NP group. (F) Overall image of trabecular bone in the anatase TiO2 NP group. (G) Sagittal image of bone in the anatase TiO2 NP group. (H) Cross-sectional image of cortical bone in the anatase TiO2 NP group. (I) Cross-sectional image of trabecular bone in the rutile TiO2 NP group. (J) Overall image of trabecular bone in the rutile TiO2 NP group. (K) Sagittal image of bone in the rutile TiO2 NP group. (L) Cross-sectional image of cortical bone in the rutile TiO2 NP group.

