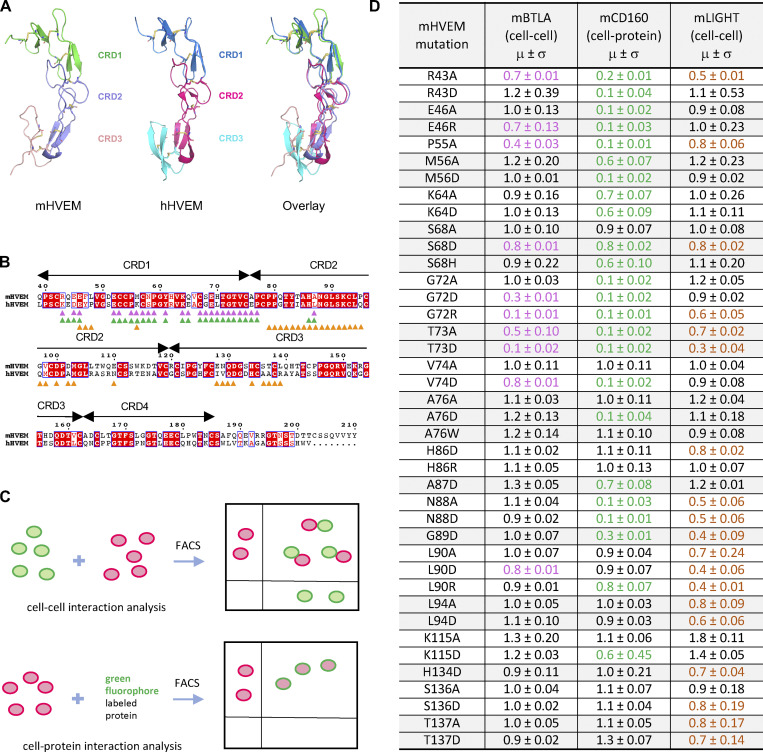
Figure 3.
Structure and mutagenesis screen of mHVEM. (A) Structures of mHVEM and hHVEM and their comparison. The disulfide bonds of HVEM are shown as sticks and each HVEM CRD is colored differently. (B) Sequence alignment of mHVEM and hHVEM. The homologous residues are highlighted in red. The residues of hHVEM directly involved in the interface with hBTLA, hCD160, and hLIGHT are marked by magenta, green, and orange triangles, respectively. (C) The schematic figure shows two ways to determine the relative binding affinities of mHVEM mutants. The cell–cell method measures the percentages of double-positive cells in the mixtures. The cell–protein method measures the percentages of green-fluorophore–stained mHVEM-mCherry–expressing cells. (D) Relative binding affinities of mHVEM mutants with its ligands are shown in the table. Both mBTLA and mLIGHT binding to mHVEM was assessed by the cell–cell method. The mCD160 binding to mHVEM was tested by cell–protein method. Error bars represent results from at least triplicates. All mHVEM mutants with ≥20% binding reduction to a particular query are colored differently to indicate their reduced affinities.

