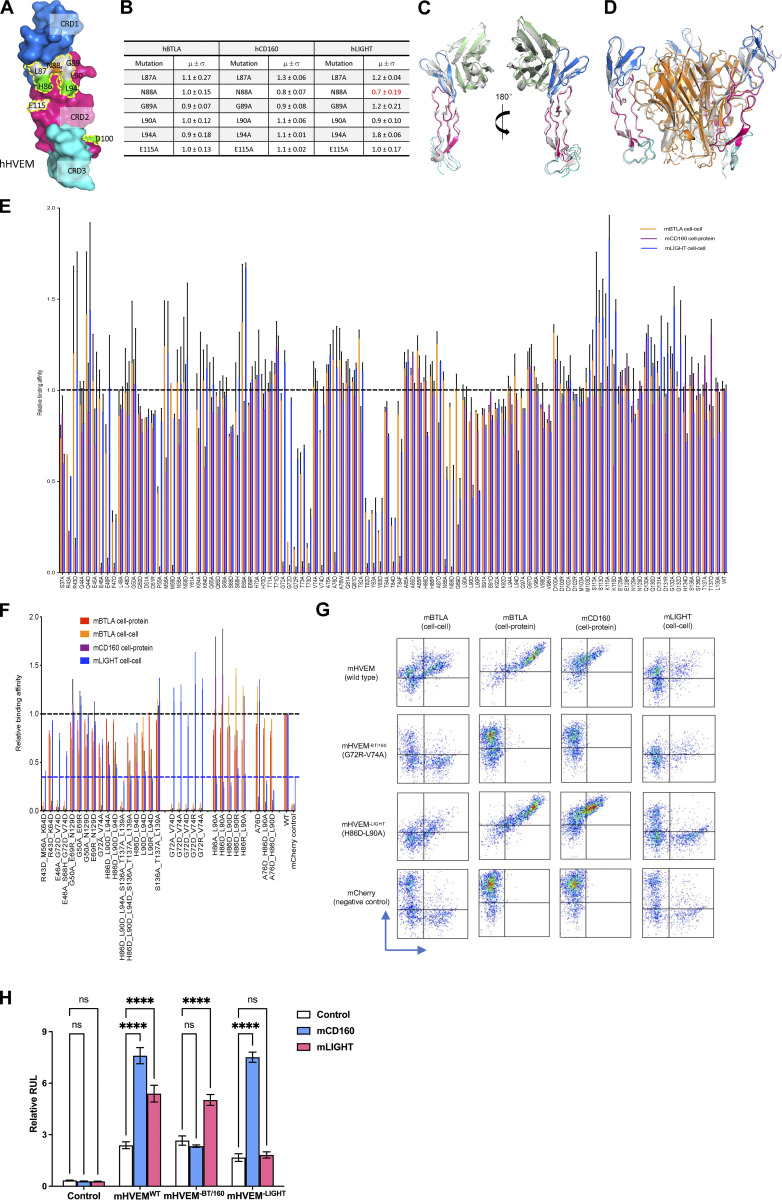
Figure S2.
Relative binding affinities of HVEM mutants with BTLA, CD160, and LIGHT. (A and B) The hHVEM mutants were expressed on the cell surface and stained by hCD160, hBTLA, and hLIGHT proteins. The relative binding affinities were measured by flow cytometry. Error bars represent results from at least triplicates. (A) Positions of the hHVEM mutation residues. The residue hLIGHT Y173 (highlighted in yellow) is shown as yellow stick in the structure. (B) Relative binding affinities of the hHVEM mutants. (C) Superimposition of hHVEM–hCD160 from the ternary complex with the hHVEM–hCD160 complex alone (gray cartoon, PDB entry 6NG3). (D) Superimposition of hHVEM–hLIGHT from the ternary complex with the hHVEM–hLIGHT complex alone (gray cartoon, PDB entry 4RSU). (E) Relative binding affinities of mHVEM single-residue muteins with its ligands. Error bars represent results from at least triplicates and are shown as black sticks. The gray dashed line marks the averaged normalized affinities of WT mHVEM with mBTLA, mCD160, and mLIGHT. (F) Relative binding affinities of mHVEM multiple-residue muteins with its ligands. Error bars represent results from at least triplicates and are shown as thinner sticks with corresponding colors. The gray dashed line marks the averaged normalized affinities of WT mHVEM with mBTLA, mCD160, and mLIGHT. Blue dashed line marks the average background noise resulting from the non-specific interaction of negative control mCherry with mLIGHT.(G) Representative flow cytometry results. The vertical axis is the mCherry fluorescence indicating mHVEM-expressing cells, and the horizontal axis is the green fluorescence staining of fusion proteins or binding partner–expressing cells, as indicated. (H) Ligand-selective mHVEM mutein signaling. 293T cells were cotransfected with mHVEMWT, mHVEM−BT/160, mHVEM−LIGHT, or control (vector only) along with an NF-κB–driven luciferase (NF-κB-Luc) vector. mHVEM/NF-κB-Luc–expressed cells were co-cultured with control or mCD160- or mLIGHT-transfected 293T cells as indicated. Luciferase activity was measured after 18 h. RLU (relative light units) is the ratio of Firefly luciferase luminescence to Renilla luciferase luminescence. Data shown are mean ± SD. ****, P < 0.0001 for two-way ANOVA. Data are representative of two independent experiments.

