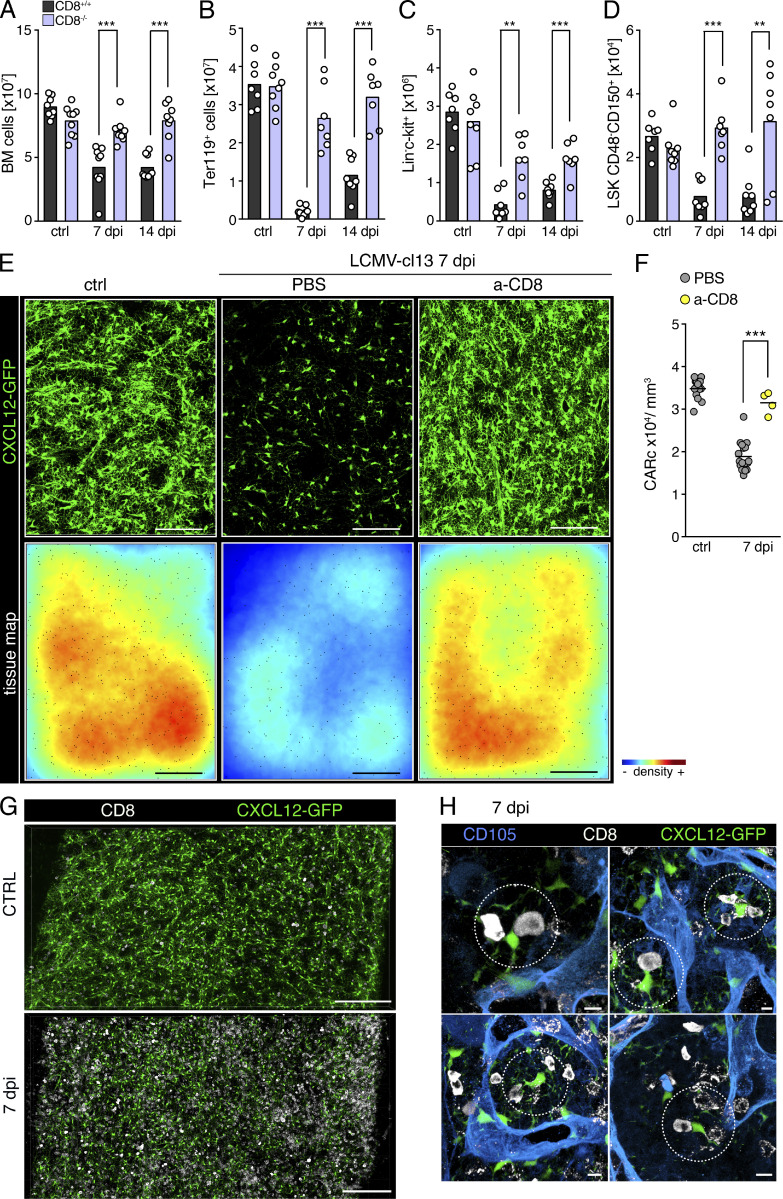
Figure 4.
CD8 T lymphocytes mediate infection-induced hematopoietic effects and destruction of BM CARc upon chronic infection. (A–D) Total cell counts for BM cellularity (A), BM erythroid progenitors (B), LK hematopoietic progenitors (C), and BM HSCs (D) in CD8+/+ (black bars) and CD8−/− (light purple) mice at different time points after infection with LCMV-cl13 (n = 7–9 samples from at least three independent experiments). (E) Maximum-intensity projection of representative images from large femoral volumes of uninfected mice (ctrl) or mice subjected to LCMV-cl13 infections and treated with PBS or anti-CD8 (a-CD8)-depleting antibody and analyzed 7 dpi. Top: Green, CXCL12-GFP (CARc). Bottom: Tissue maps depicting CARc density levels according to a color-coded scale. Scale bar, 200 µm. (F) CARc densities assessed by 3D QM at indicated time points after infection (n = 4–9 samples from at least two independent experiments) in control and CD8 T cell–depleted mice. (G and H) Representative images of BM CD8+ T cells and CARc in mice before infection and 7 dpi with LCMV-cl13. Low-magnification images of global distribution and frequencies of both cell types are shown in G. (H) Examples of closely interacting CD8 T cell and CARc frequently found throughout BM tissues (dotted circles). Statistics were analyzed by two-tailed t test with **, P < 0.01; ***, P < 0.001; ns, P > 0.05.

