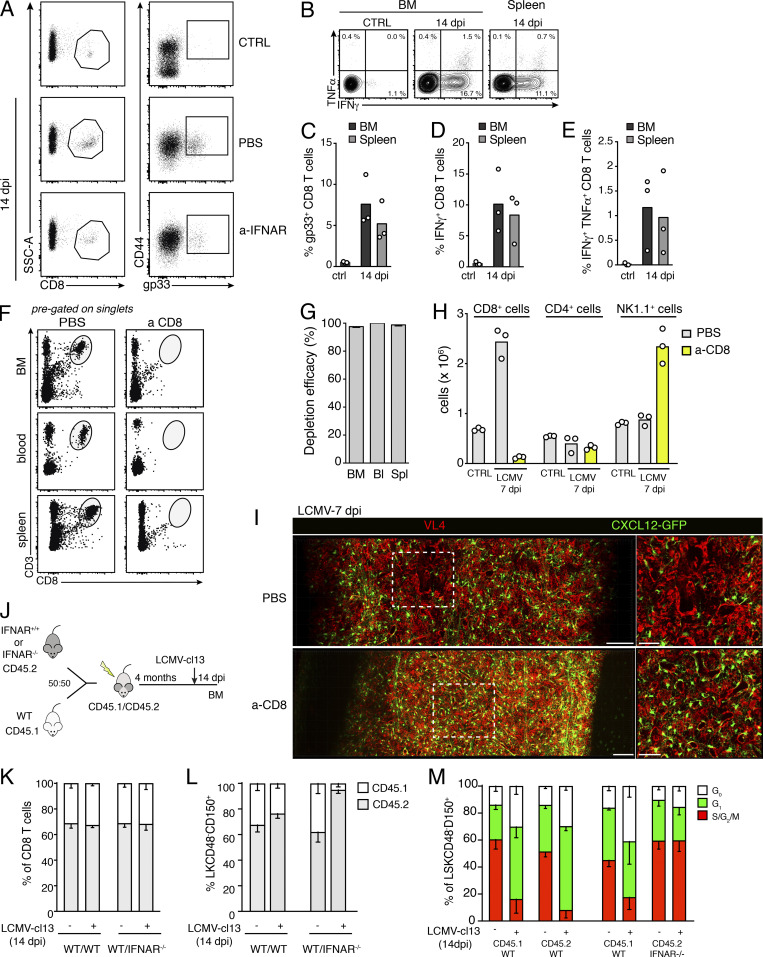
Figure S4.
CD8 T cells mediate viral-induced effects in the BM. (A) Gating of gp33+ tetramer-specific CD8 T cells in the BM of control mice (CTRL) and mice treated with a-IFNAR 14 dpi with LCMV-cl13. SSC, side scatter. (B) Contour plot showing intracellular immunostaining for IFNγ and TNFα of CD44+CD8+ activated T lymphocytes in uninfected mice (CTRL) or 14 dpi with LCMV-cl13. (C–E) Percentages of CD8 gp33+ T cells (C), IFNγ+CD8+ T cells (D), and IFNγ+TNFα+ CD8+ T lymphocytes (E) in the BM and spleen 14 dpi with LCMV-cl13 (n = 3 mice per time point). (F–H) Anti-CD8 antibody administration efficiently depletes CD8+ T cells from BM and peripheral organs. (F) Dot plots showing representative gating for CD8 T lymphocytes (CD3+CD8+, pregated on singlets) in BM, blood, and spleen before and after antibody-mediated depletion. (G) Quantification of depletion efficacy, n = 4 mice. Depletion was calculated as 100% abundance in depleted mice, with abundance calculated as percentage of normal CD8+ T cell counts. Bl, blood; Spl, spleen. (H) Absolute numbers of CD8+, CD4+, and NK1.1+ cells in the BM of mice treated with PBS or anti-CD8 7 dpi with LCMV-cl13. (I) Maximum-intensity projection of a representative femoral cavity BM of mice treated with PBS or anti-CD8, 7 dpi with LCMV-cl13. Red, VL4 (actively replicating LCMV particles); green, CXCL12-GFP (BM CARcs). Scale bars, 100 µm (left, whole diaphysis); 50 µm (right, zoomed-in image). (J–M) Experimental layout depicting infection of chimeric mice and results of CD8 and HSC ratios and cell cycle status 14 dpi (J). Quantification of the ratio of CD8 T cells (K) and HSPCs (Lin−c-kit+CD48−CD150+ cells; L), in the BM of WT/WT and WT/IFNAR chimeras before and after infection. (M) Cell cycle status of WT and IFNAR−/− HSCs in chimeric mice, before infection and 14 dpi with LCMV-cl13 (n = 2–5 mice per group from two independent experiments).

