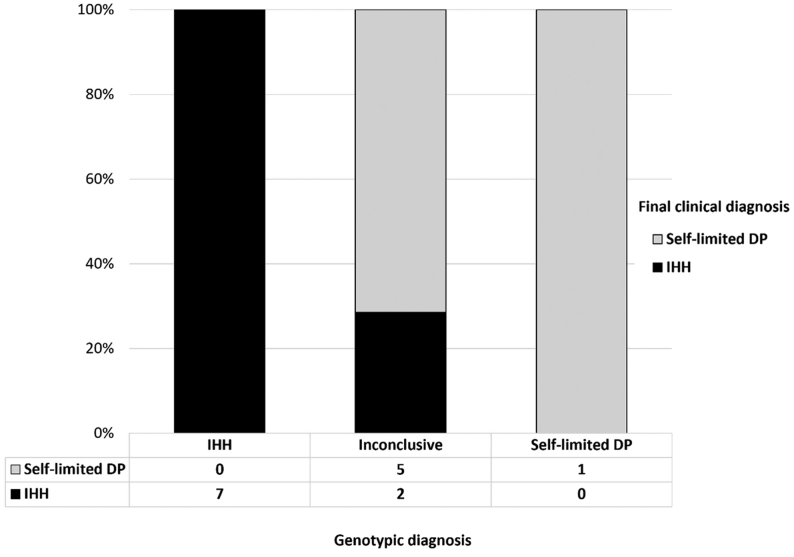
Figure 3.
Clinical diagnosis of the patients who underwent WES with variants identified and grouped by genotypic criteria (n = 19). X-axis shows three groups of genotypic diagnosis in patients who underwent WES. Y-axis shows the percentage of patients in each genotype diagnosis. Clinical diagnosis is shown by bars as indicated.

 This work is licensed under a