
Figure 2. . Violin plots depicting FSCN1 gene expression in different datasets.
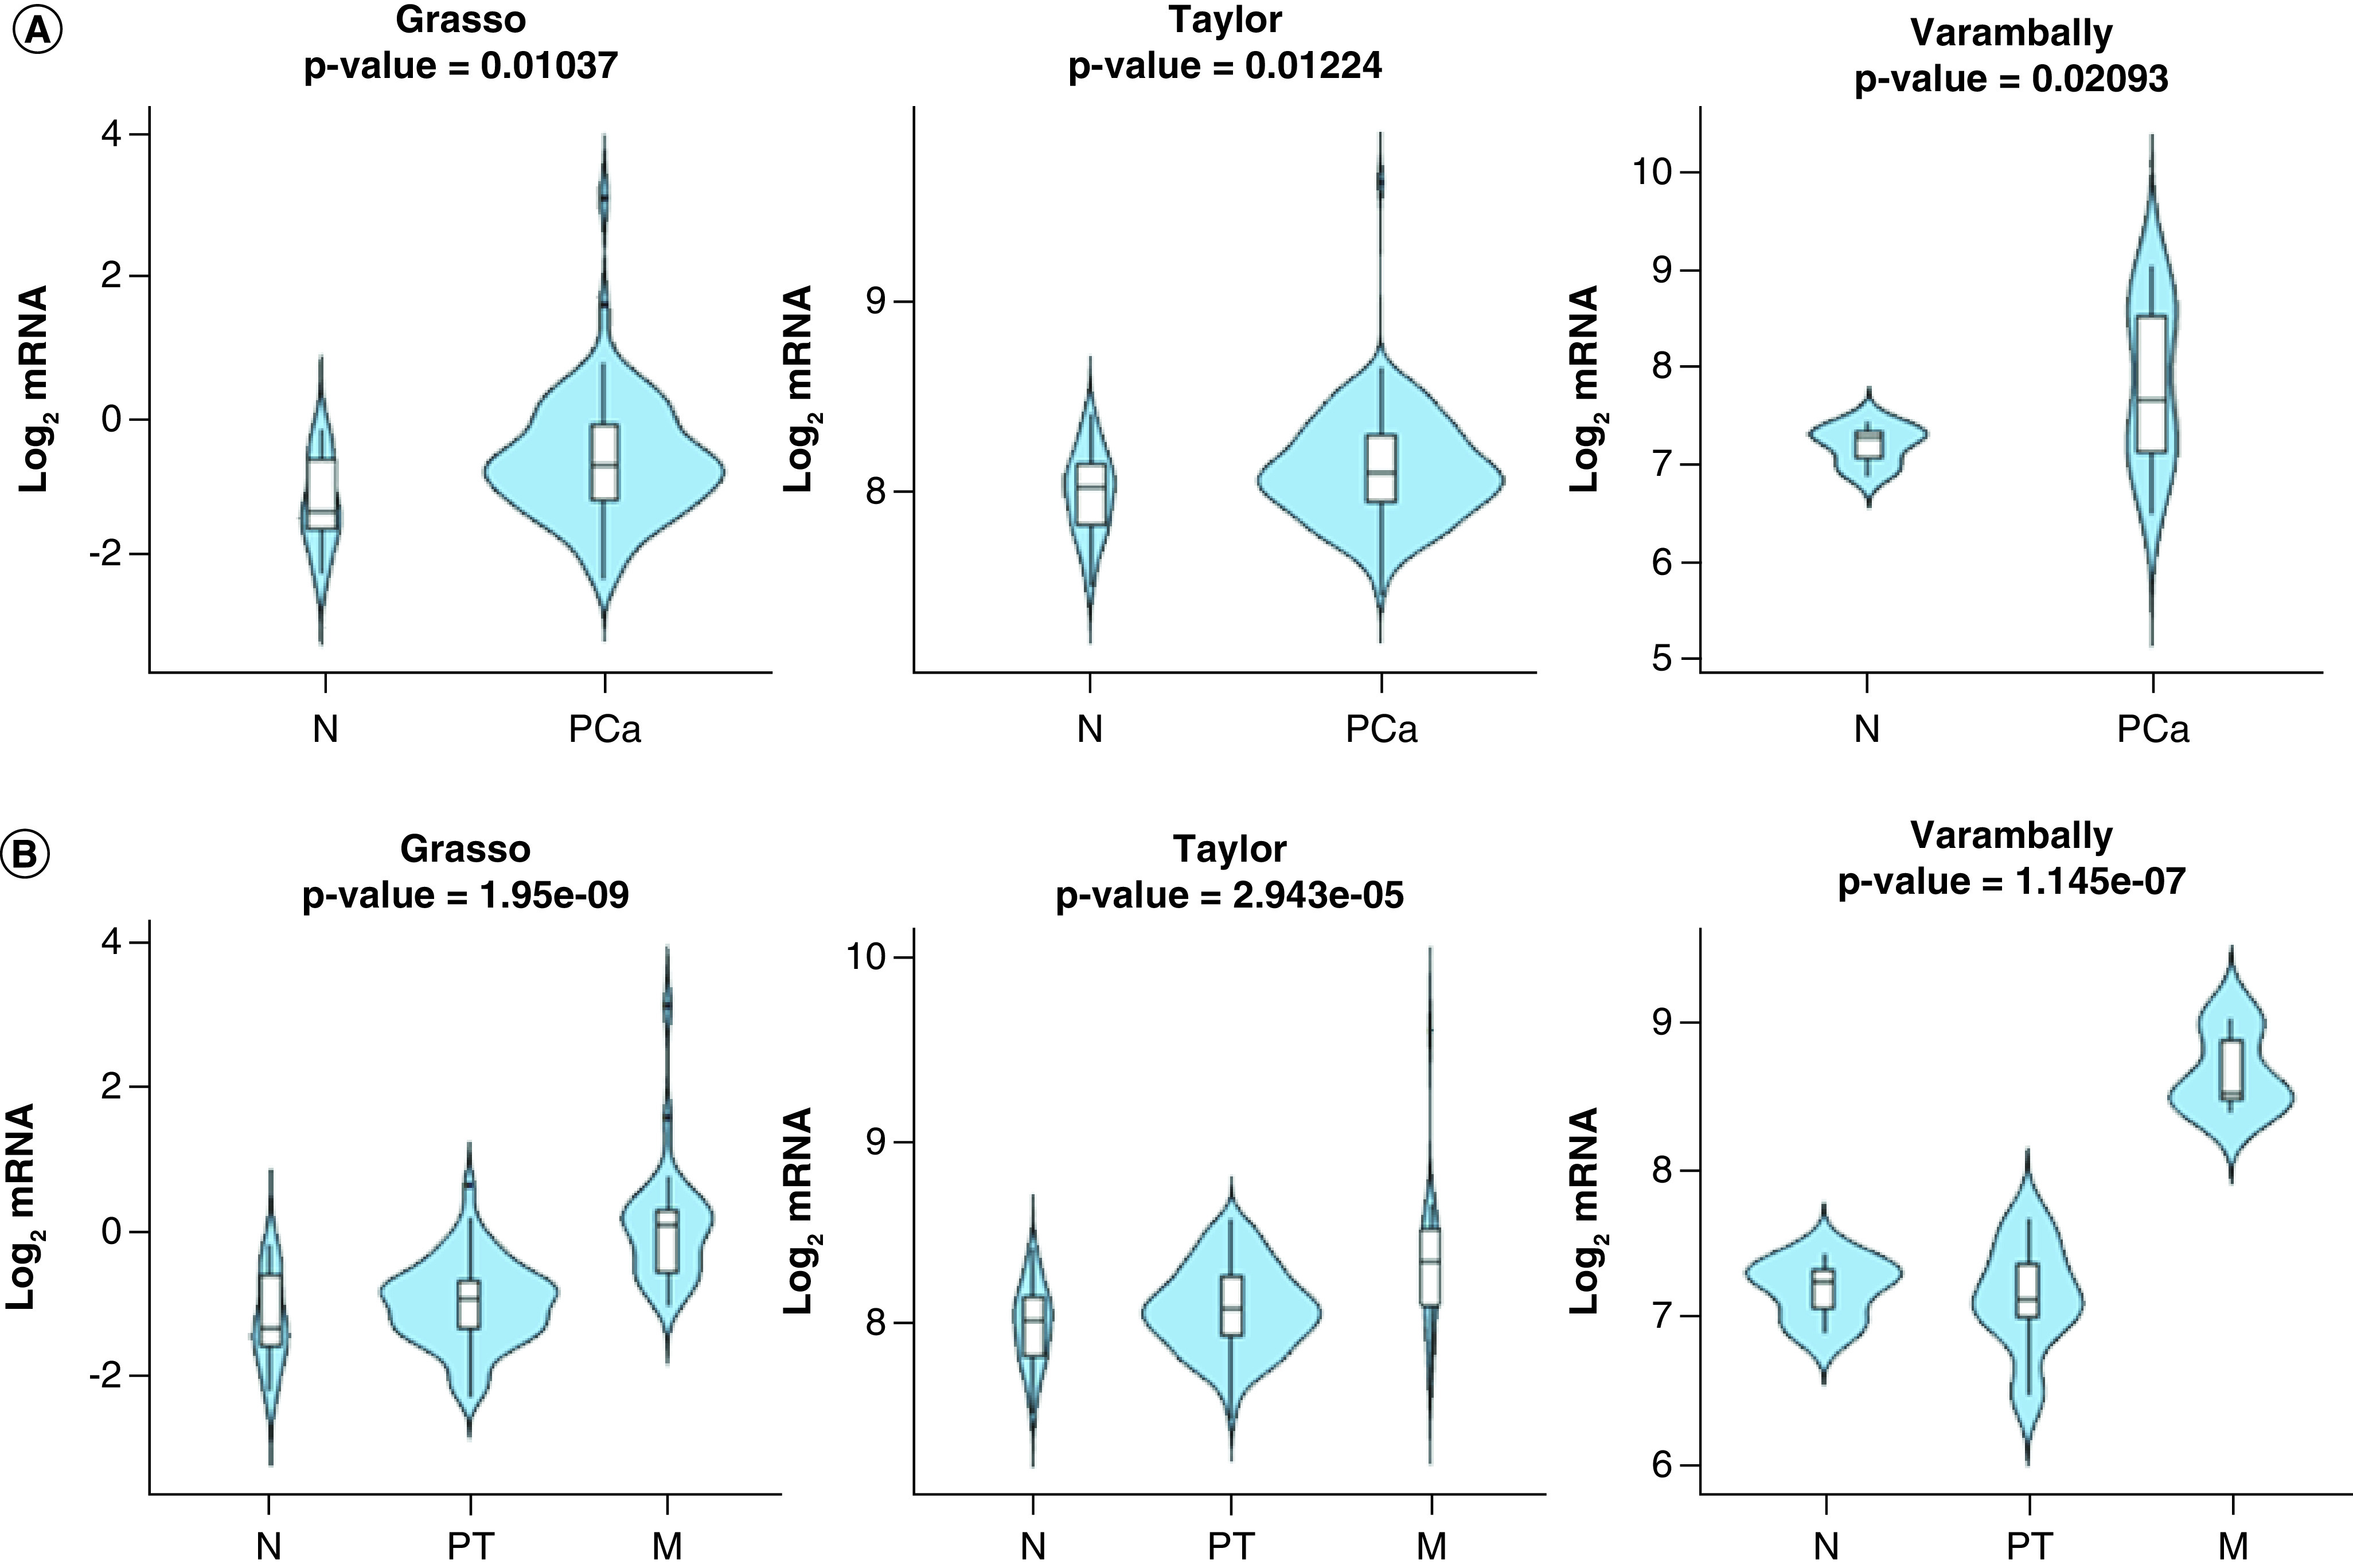
(A) Between nontumoral (N) and prostate cancer (PCa) specimens in the indicated datasets. The Y-axis represents the Log2-normalized gene expression (fluorescence intensity values for microarray data or, sequencing reads values obtained after gene quantification with RNA-Seq by expectation maximization (RSEM) and normalization using upper quartile in case of RNAseq). A Student t-test is performed in order to compare the mean gene expression between two groups. (B) Among N, primary tumor and metastatic PCa specimens in the indicated datasets. The Y-axis represents the Log2-normalized gene expression (fluorescence intensity values for microarray data or, sequencing reads values obtained after gene quantification with RSEM and normalization using upper quartile in case of RNAseq). An ANOVA test is performed in order to compare the mean gene expression among two groups.
M: Metastatic; N: Nontumoral; PT: Primary tumor.