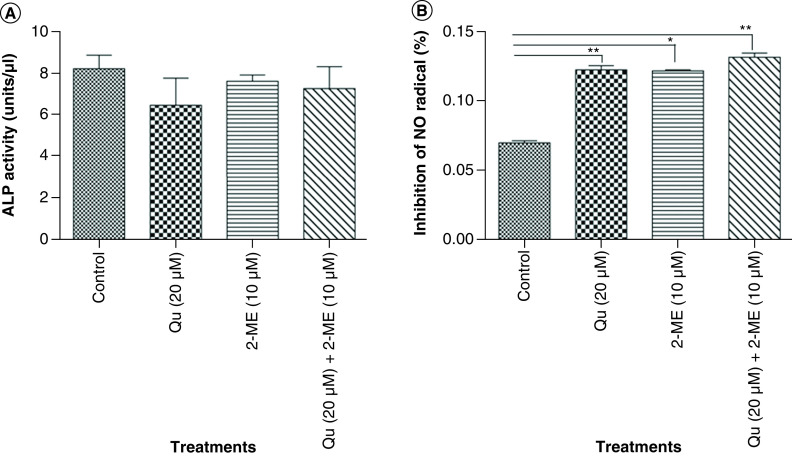
Figure 3. . Alkaline phosphatase and reactive oxygen species activity of PC-3 cells.
(A) Depicts % inhibition of NO2 upon treatment with all the three groups of drug. Data represented as mean ± SEM from three independent experiments. The statistical analysis was performed using ANOVA with Tukey’s post hoc multicomparison test (*p < 0.05; **p < 0.01; ***p < 0.001). (B) ALP activity was analyzed using colorimetric alkaline phosphates activity detection kit. Data represented as mean ± SEM from three independent experiments. The statistical analysis was performed using ANOVA with Tukey’s post hoc multicomparison test (*p < 0.05; **p < 0.01; ***p < 0.001).
2-ME: 2-methoxyestradiol; ALP: Alkaline phosphatase; EMT: Epithelial–mesenchymal transition; Qu: Quercetin.

