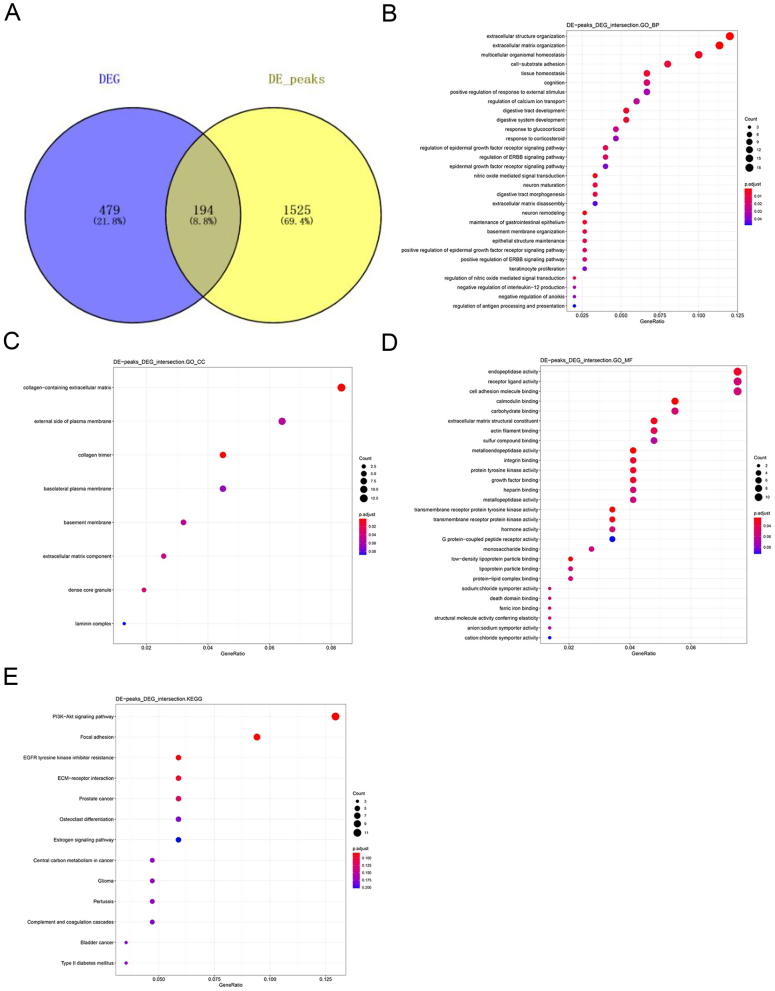
Figure 3.
(A) Venn diagram of intersecting the results of m6A methylation analysis and transcriptome difference ananlysis. (B, C and D) GO terms enrichment analysis of mMDEGs. (B) The top 30 significantly enriched BPs of mMDEGs. (C) All CCs of mMDEGs. (D) The top 10 MFs of mMDEGs. (E) KEGG pathway analysis of mMDEGs.

 This work is licensed under a