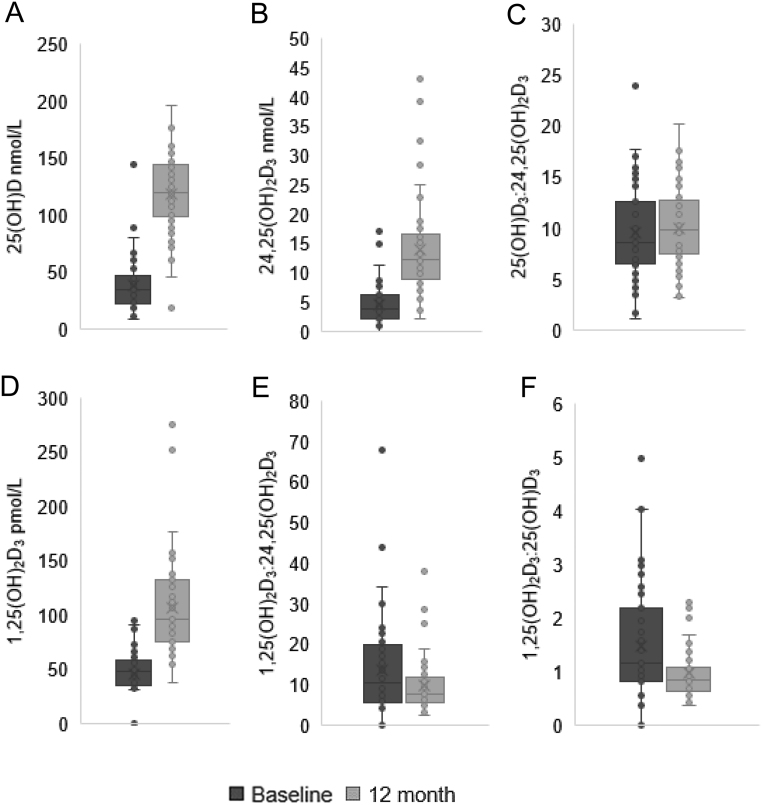
Figure 2.
Serum 25(OH)D, 24,25(OH)2D3 and 1,25(OH)2D3, and the metabolite ratios 25(OH)D3:24,25(OH)2D3, 1,25(OH)2D3:24,25(OH)2D3 and 1,25(OH)2D3:25(OH)D3 at baseline and 12 months. Serum 25(OH)D, 24,25(OH)2D3 and 1,25(OH)2D3 were measured using LC-MS/MS and the ratios 25(OH)D3:24,25(OH)2D3, 1,25(OH)2D3:24,25(OH)2D3 and 1,25(OH)2D3:25(OH)D3 calculated, in patients at baseline, pre-cholecalciferol supplementation (T0), and again at 12 months (T1). (A) Serum 25(OH)D increased: 35.1 nmol/L (23.0–47.5) vs 130.0 nmol/L (99.5–143.3), P < 0.001. (B) Serum 24,25(OH)2D3 increased: 3.8 nmol/L (2.3–6.0) vs 12.3 nmol (9.0–16.4), P < 0.001. (C) No significant change in 25(OH)D3:24,25(OH)2D3: 9.1 (7.0–12.4) vs 10.3 (8.0–12.9) respectively, P = 0.70. (D) Serum 1,25(OH)2D3 increased: 48.3 pmol/L (35.9–57.9) vs 96.2 pmol/L (77.1–130.6), P < 0.001. (E) 1,25(OH)2D3:24,25(OH)2D3 reduced: 10.4 (5.8–19.4) vs 7.9 (5.6–11.9) P = 0.05. (F) 1,25(OH)2D3:25(OH)D3 also reduced: 1.2 (0.8–2.1) vs 0.9 (0.6–1.1), P = 0.01. Wilcoxon signed rank test. Data represent median (IQR), n = 55.

 This work is licensed under a