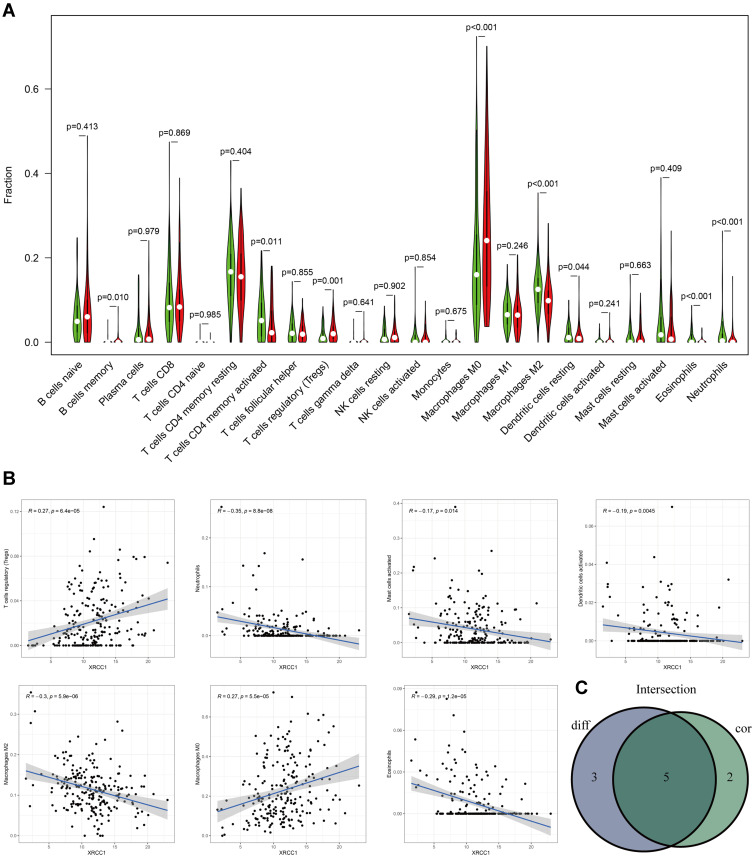
Figure 4.
Correlation of TILs with XRCC1 expression based on TCGA-COAD cohort. (A) Violin plot showing the ratio differentiation of 22 types of immune cells between COAD tumor samples with high or low XRCC1 expression. (B) Scatter plot showing seven types of TILs correlated with XRCC1 expression. (C) Venn plot displaying five types of TILs correlated with XRCC1 expression co-determined via difference and correlation tests illustrated as violin and scatter plots, respectively. The statistically significant (P value < 0.05).

