
Figure A2.
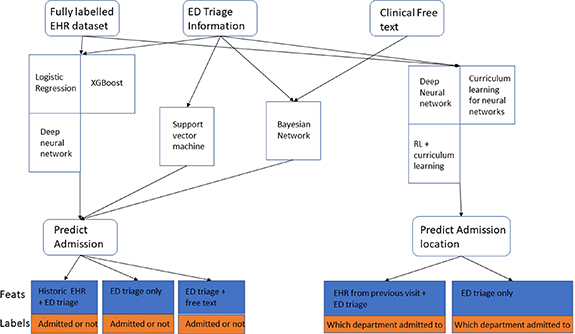
A flowchart showing the models that have been used for the separate prediction problems for predicting ED to inpatient admissions. The top row shows the sources of data used, the row below shows the models that have been used in various different works for the prediction problem, below this is the problem being tackled and below each of these problems is one of the datasets used in a study to train the model.