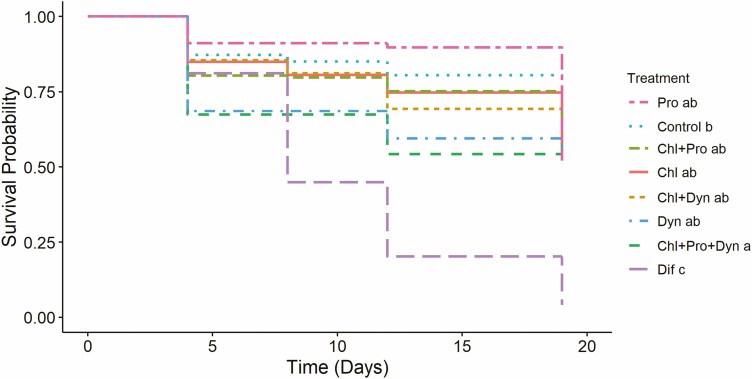
Fig. 4.
Kaplan–Meier survival curves for queens reared with each pollen treatment. Data for each chemical were pooled across all trials. Counts of living and dead queens were taken on days 4 (capping), 8, 12 (emergence), and up to 7 d post-emergence (day 19). Letters in the legend indicate significant differences (P < 0.05). Exact P values are presented in Supp Table 5 [online only]. Items in the legend are ordered by their mean rate of survival on day 19.

