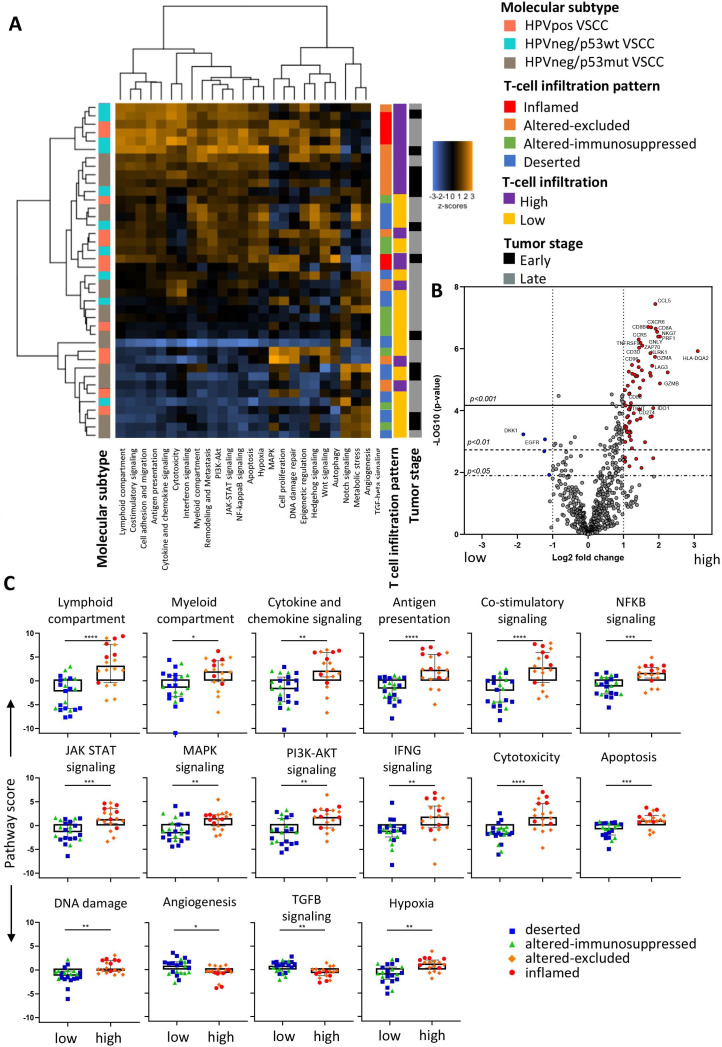
Figure 2.
Immune-related pathways and single genes differ between high and low infiltrated tumors. Forty VSCC samples of all three molecular subtypes (HPVpos VSCC (n=12), HPVneg/p53wt (n=10) and HPVneg/p53mut (n=18)) were analyzed for 25 predefined immune-related pathways within the PanCancer IO360 panel. (A) Heatmap plot displaying pathway scores of the 25 immune-related pathways. Pathway scores were calculated with using nCounter Advanced Analysis module 2.0 software and displayed as Z-transformed values with orange representing high scores and blue representing low scores. (B) Volcano plot depicting the differentially expressed genes (DEGs; n=79/750) between high and low infiltrated tumors based on a log2 fold change of >1 or <−1 in combination with Benjamini-Hochberg (BH) adjusted p<0.05. Lines indicate the indicated significant BH values. Significant (p<0.05) upregulated DEGs in high infiltrated tumors are indicated in red and in low infiltrated tumors in blue. (C) Box plots showing the differences in the immune-related pathway scores between low and high infiltrated VSCC. Color codes indicate the T cell infiltration pattern observed in the patients. *p<0.05, **p<0.01, ***p<0.001, and ****p<0.0001. VSCC, vulvar squamous cell carcinoma

