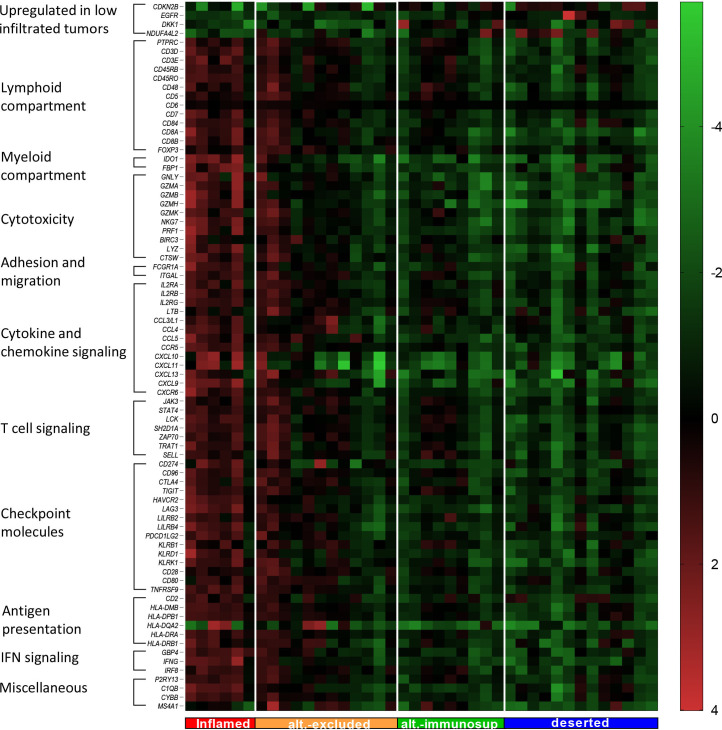
Figure 4.
High infiltrated tumors showed higher expression of immune-related single genes and checkpoint inhibitors. Heatmap displaying all significant differentially expressed genes (corrected p value <0.05 and log2 fold change >1 or <−1) between high and low infiltrated tumors. Genes were manually categorized in groups based on their main effector function (vertical column) and tumors were ordered based on their corresponding T cell infiltration pattern (horizontal axis).9 Expression of the selected single genes in the heatmap were given as 2log2 transformed values relative to the average value of that particular gene.

