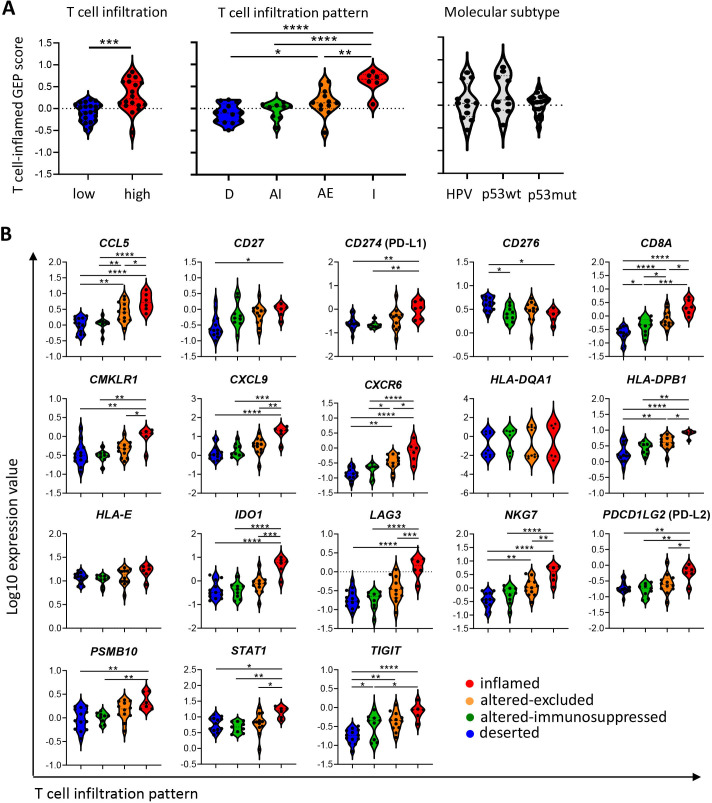
Figure 5.
High infiltrated tumors are associated with a higher T cell inflamed gene expression profile (GEP) score. Forty early-stage and late-stage VSCC samples were analyzed by the Nanostring IO360 PanCancer panel. (A) Violin plots displaying the T cell inflamed GEP score for T cell infiltration (left), T cell infiltration pattern (middle) and tumor molecular subtype (right). The T cell inflamed GEP score was calculated as the weighted sum of the normalized expression values of 18 genes.19 (B) Violin plots displaying the normalized expression values of the single T cell GEP genes. Values are given as log10-transformed values. *P<0.05, **p<0.01, ***p<0.001, and ****p<0.0001.

