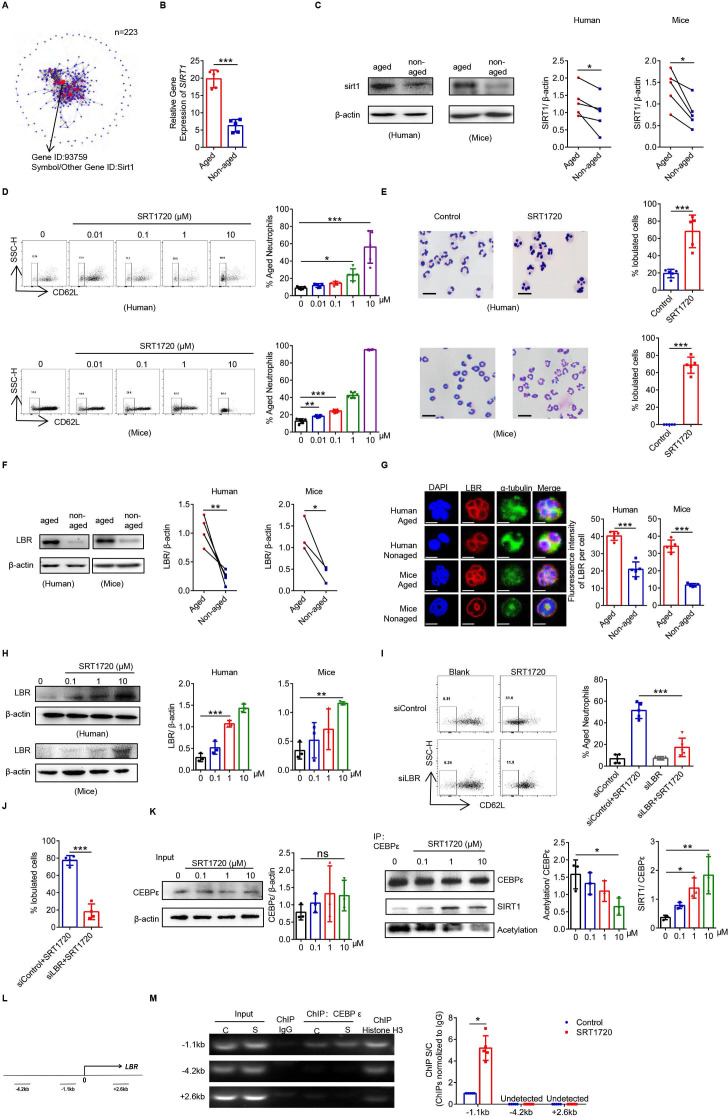
Figure 4.
The SIRT1-C/EBPε-Lamin B receptor (LBR) axis regulates the oversegmentation of Naged. (A) Protein network analysis of RNAseq of differentially expressed transcription factors in tumor-associated aged and non-aged neutrophils. (B) Analysis of the mRNA expression of SIRT1 in lung aged and non-aged neutrophils from 2 weeks tumor-bearing mice. (C) Levels of the SIRT1 protein in aged and non-aged neutrophils in the PB from patients with breast cancer and lung from 2 weeks tumor-bearing mice. (D) Flow cytometry analysis (left panel) and quantification (right panel) of aged neutrophils in the PB from patients with breast fibroadenoma (upper panel) and BM from naïve mice (lower panel) treated with different concentrations of SRT1720 for 4 hours in vitro. (E) Representative images and quantification of Giemsa staining showing the nucleus morphology of neutrophils in PB from patients with breast fibroadenoma (upper panel) and BM from naïve mice (lower panel) treated with SRT1720 for 4 hours in vitro. Scale bar, 5 µm. (F) levels of the LBR protein in aged and non-aged neutrophils in the PB from patients with breast cancer and lung of 2 weeks tumor-bearing mice. (G) Cellular immunofluorescence staining of aged and non-aged neutrophils from the PB of patients with breast cancer and lung of 2 weeks tumor-bearing mice. Blue, DAPI. Red, LBR. Green, α-tubulin. Scale bar, 2 µm. (H) Levels of the LBR protein on neutrophils in PB from patients with breast fibroadenoma and BM of naïve mice treated with SRT1720 for 4 hours in vitro. (I, J) Flow cytometry analysis (I) and Giemsa staining of the nucleus morphology (J) of siControl-transfected and siLBR-transfected neutrophils derived from the BM of naive mice treated with SRT1720 for 4 hours in vitro. Scale bar, 5 µm. (K) Co-immunoprecipitation analysis of the acetylation of C/EBPε in neutrophils from the BM of naïve mice treated with SRT1720 for 4 hours in vitro. (L) Three primer sets in the LBR locus used to amplify chromatin immunoprecipitation (ChIP)’d DNA. (M) Distribution of C/EBPε at the LBR locus. C, Control. S, SRT1720. ChIP assays were performed using C/EBPε. ChIP’d DNA was analyzed using qPCR. The bar graph shows the ratios of ChIP’d DNA signals (normalized to IgG). Data are presented as the means±SD from one representative experiment. Similar results were obtained from three independent experiments, unless indicated otherwise. Statistical analysis was performed by two-tailed unpaired Student’s t-test (B, E, G, J, M), paired Student’s t-test (C, F) and one-way ANOVA (D, H, I, K). *P˂0.05, **p˂0.01, and ***p˂0.001. ANOVA, analysis of variance; BM, bone marrow; ns, not significant; PB, peripheral blood.

