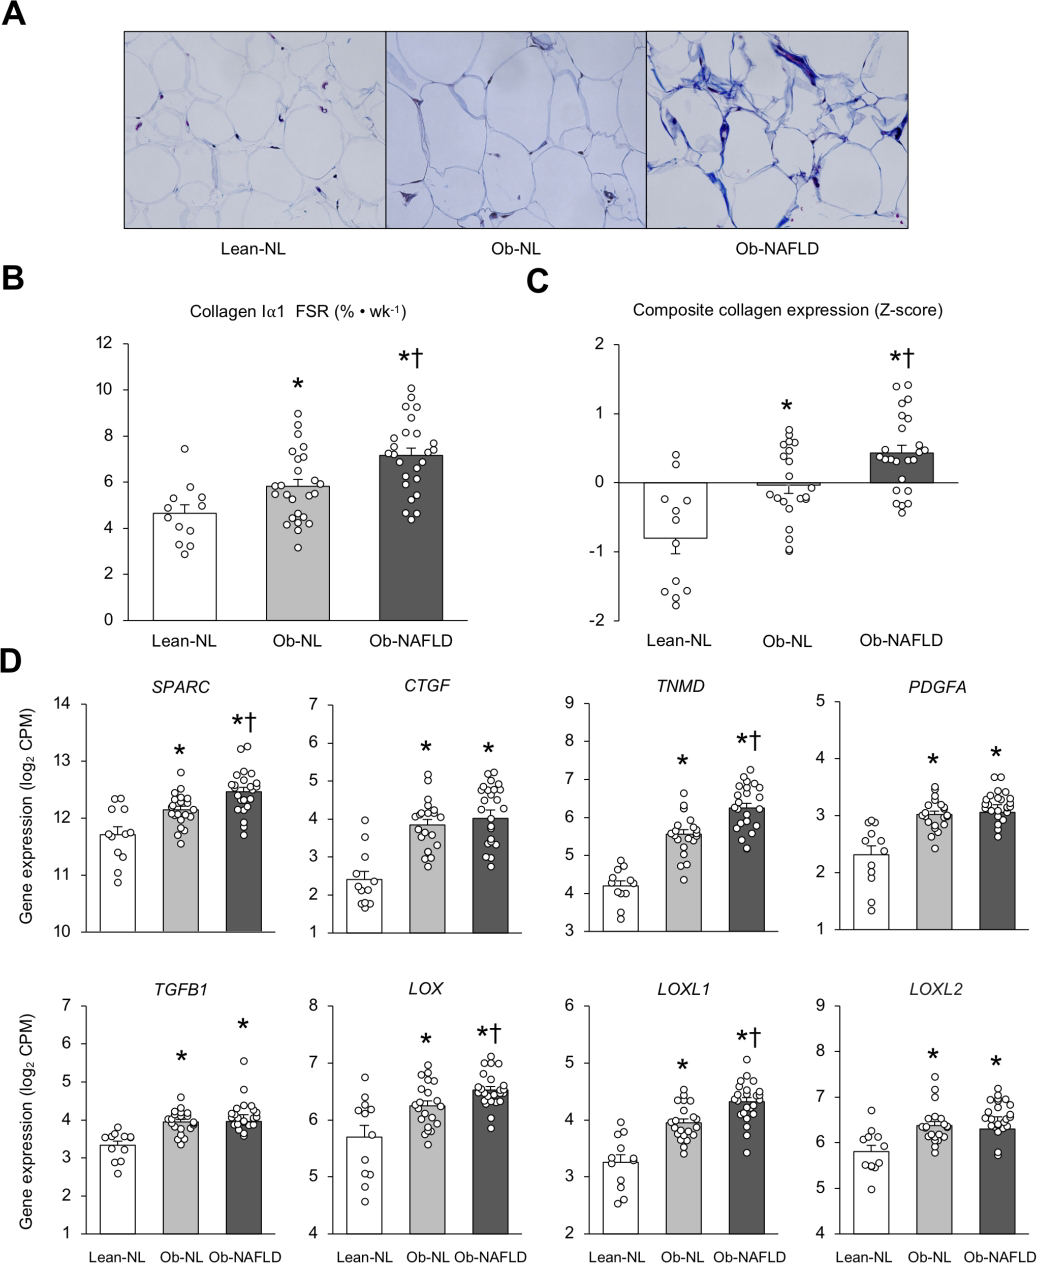
Figure 2. Collagen synthesis rate in subcutaneous adipose tissue is increased in people with obesity and NAFLD.

Masson’s trichrome staining of collagen of subcutaneous abdominal adipose tissue from representative Lean-normal (Lean-NL), Obese-normal (Ob-NL) and Obese-NAFLD (Ob-NAFLD) participants (A). Collagen Iα1 fractional synthesis rate (B), composite collagen gene expression (C) and expression of key regulators of extracellular matrix remodeling (D) in subcutaneous abdominal adipose tissue in the Lean-normal (Lean-NL; n=12), Obese-normal (Ob-NL; n=25 in panel B, and n=21 in panels C and D) and Obese-NAFLD (Ob-NAFLD; n=25 in panel B, and n=24 in panels C and D) groups. Data are means ± SEM. The composite collagen gene expression values presented in panel C are the average of collagens 1A1, 1A2, 3A1, 5A1, 5A2, 5A3, 6A1, 6A2, 6A3, 12A1, 14A1 and 24A1 after converting expression of each isoform to a Z-distribution. One-way analysis of variance (ANOVA) with Fisher’s least significant difference post-hoc testing used to identify significant mean differences between groups. *P<0.05 vs. Lean-NL. †P<0.05 vs. Ob-NL. CPM=counts per million.
