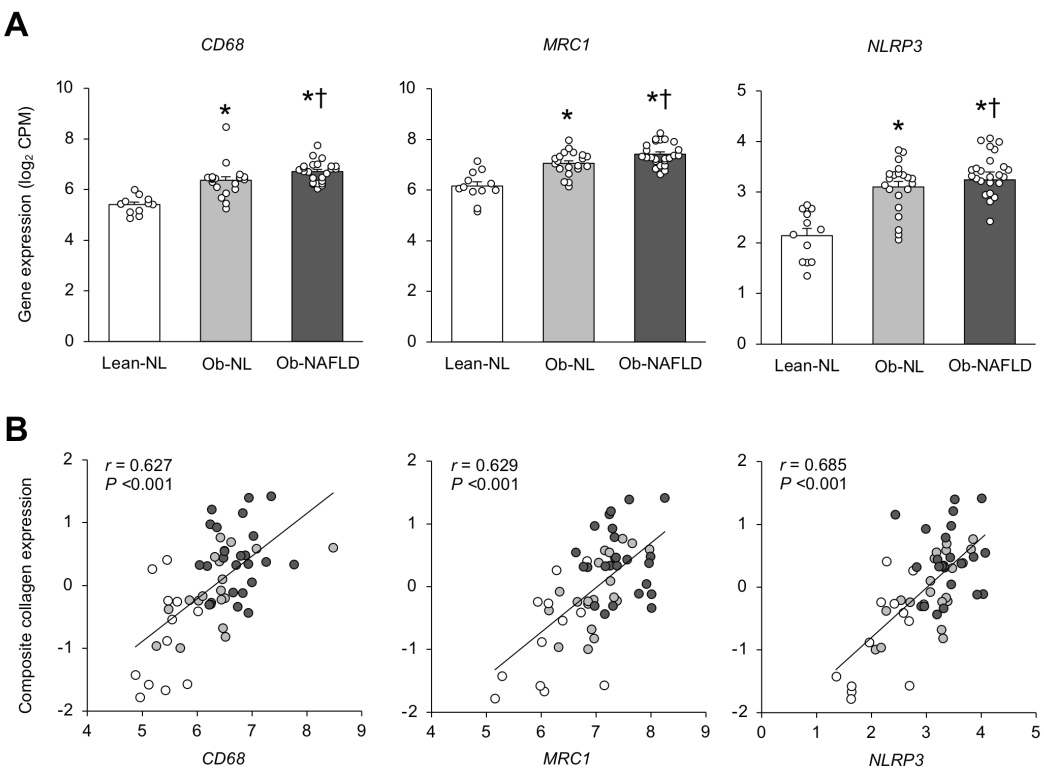
Figure 4. Adipose tissue expression of macrophage markers and the NLRP3 inflammasome and their relationship with collagen gene expression.

Expression of the macrophage markers, cluster of differentiation 68 (CD68), and mannose receptor C-type 1 (MRC1), and nod-like receptor protein 3 (NLRP3) inflammasome (A) and their relationships with composite collagen gene expression in subcutaneous abdominal adipose tissue (B) in the Lean-normal (Lean-NL; n=12), Obese-normal (Ob-NL; n=21) and Obese-NAFLD (Ob-NAFLD; n=25) groups. Data are means ± SEM in panel A and one-way analysis of variance (ANOVA) and Fisher’s least significant difference post-hoc testing used to identify significant mean differences between groups. *P<0.05 vs. Lean-NL. †P<0.05 vs. Ob-NL. In panel B, Individual data represent Lean-NL (white circles), Ob-NL (gray circles) and Ob-NAFLD (black circles) participants with linear regression analysis used to describe the relationship between factors. CPM=counts per million.
