
Figure 5. Therapeutic effects of Nintedanib or Pirfenidone, two approved drugs, are not related to MAVS.
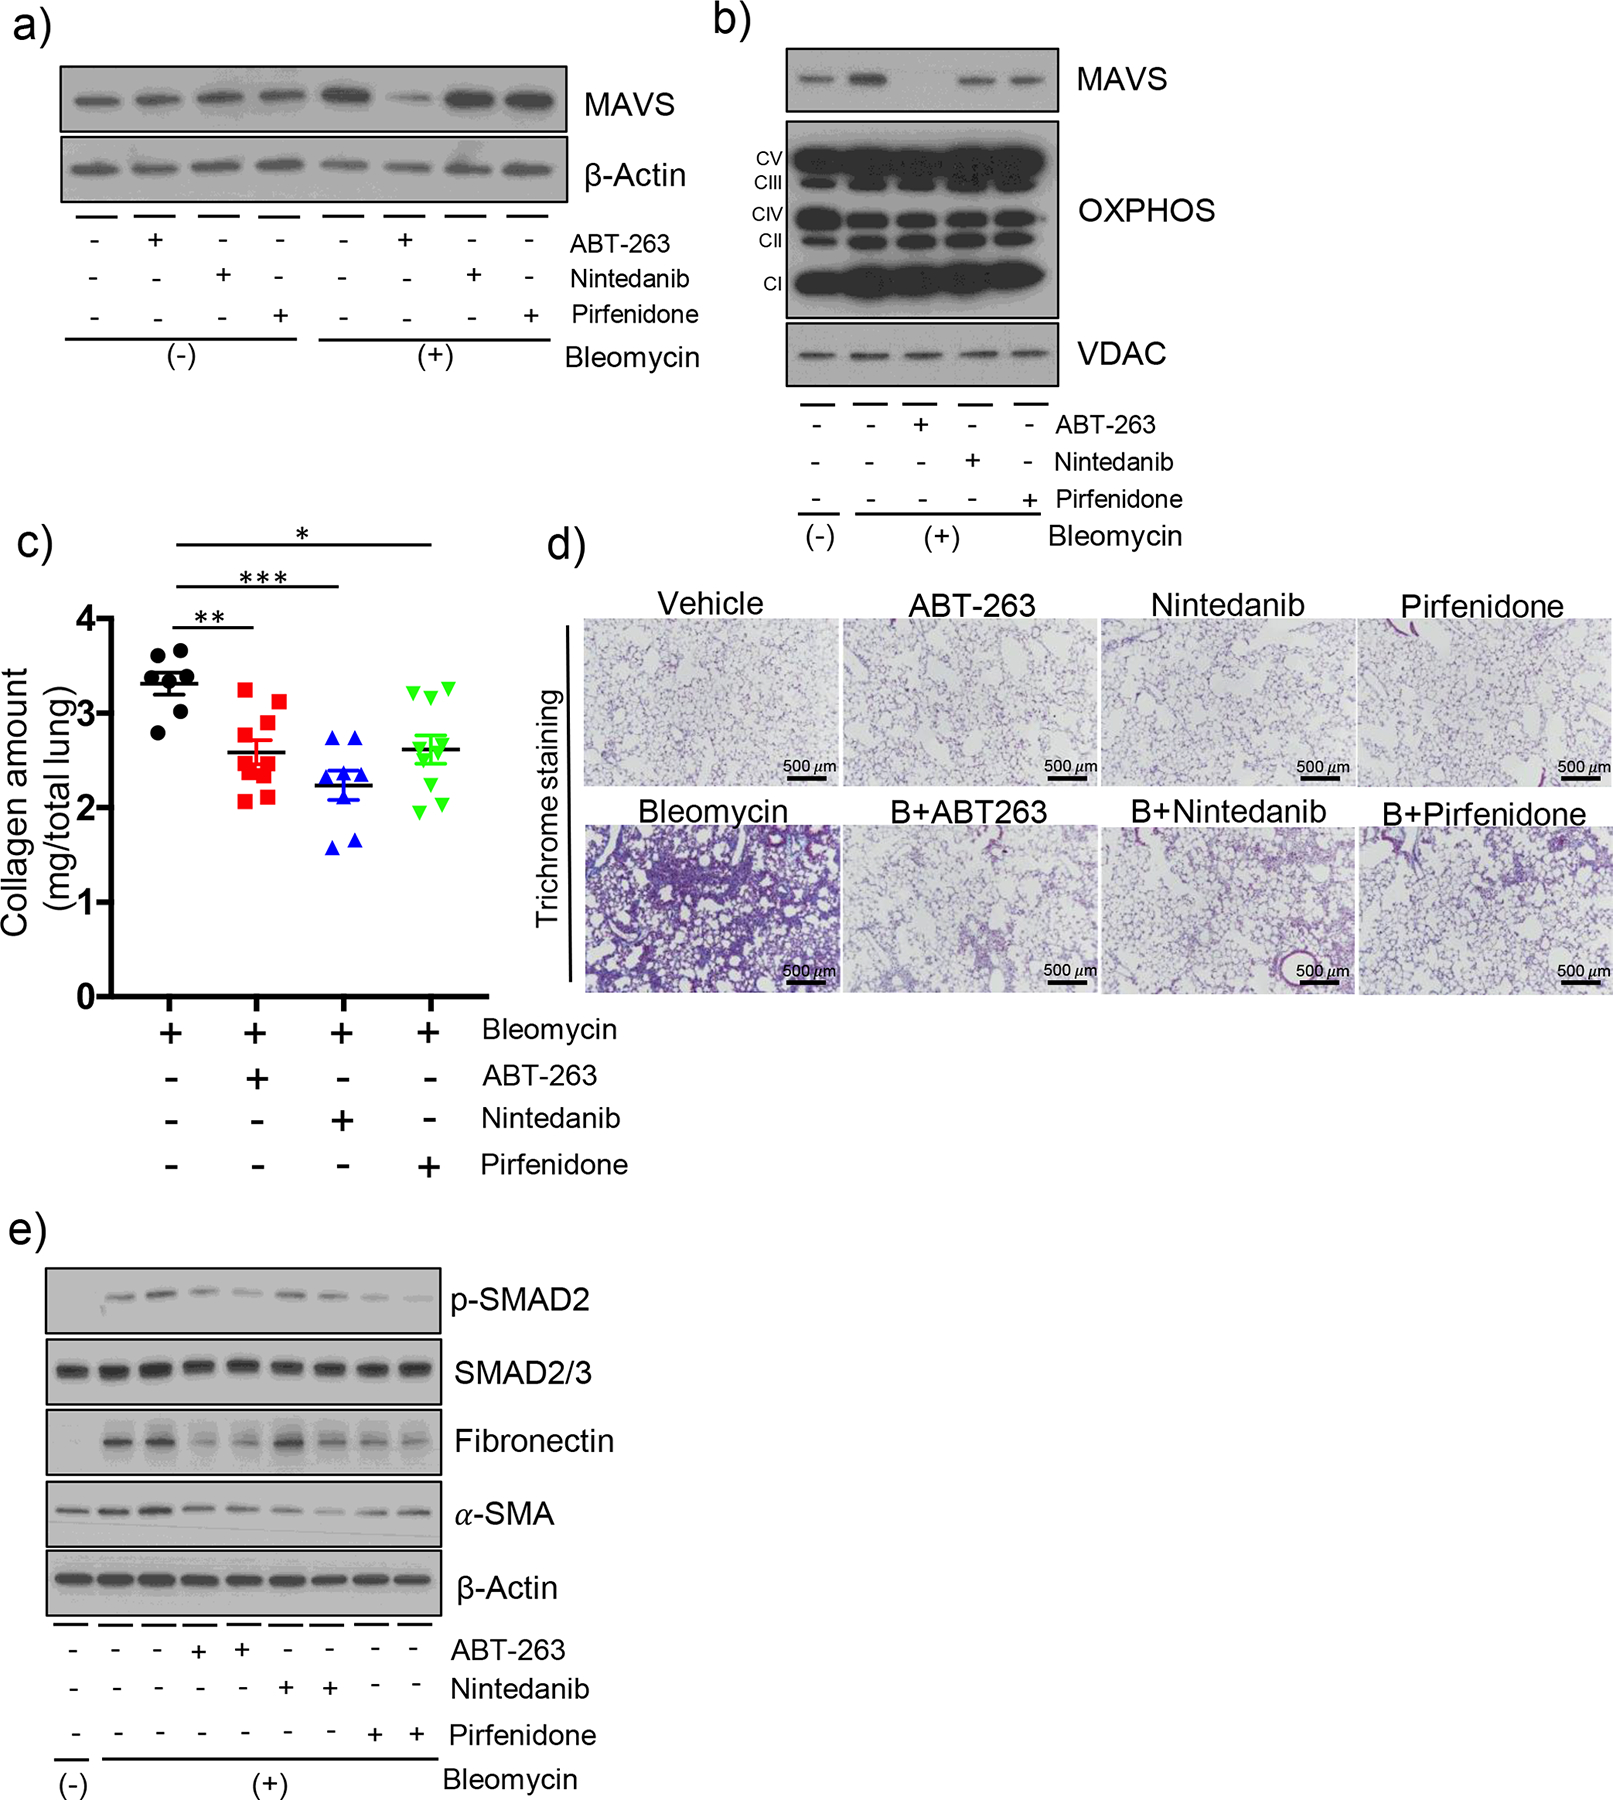
(a-b) MLE-12 cells were treated with ABT-263 (100 μM), Nintedanib (100 μM) and Pirfenidone (100 μM) for 3 h after 10 mU/ml bleomycin treatment for 3 days. The expression of MAVS from (a) whole cell lysates, and (b) mitochondrial fractions, respectively, was evaluated by Western blot analysis. In panel (b), the expression of OXPHOS complexes and VDAC protein as loading controls of mitochondria are presented. (c) The evaluation results of the total lung collagen contents and (d) the representative images of Masson’s trichrome staining evaluation are presented. C57BL/6J wild type mice were administered with bleomycin (+) and treated after day 8 with ABT-263 (40 mg/kg, every 2 d, i.p.), Nintedanib (40 mg/kg, every 2 d, i.p.) and Pirfenidone (40 mg/kg, every 2 d, i.p.), and sacrificed at day 21. Each dot indicates the individual mouse used for the experiment. (n=10 per bleomycin treatment group (3-mice dead), n=10 per Bleomycin+ABT-263 treatment group, n=10 per Bleomycin+Nintedanib treatment group (2-mice dead) and n=10 per Bleomycin+Pirfenidone treatment group, respectively). (Scale bars: 500 μm). (e) Western blot evaluations for p-SAMD2, SMAD2/3, Fibronectin and a-SMA proteins from whole lung tissue lysates, respectively, at day 14 after bleomycin administration are presented. For panels (a) and (e), β-Actin was used as a loading control. Data are the mean ± SEM. Statistical significance was calculated using the 2-way ANOVA with Tukey’s multiple comparisons test (c) *, P < 0.05; **, P < 0.01; ***, P < 0.001.