
Figure 3. Capturing the activity of slow-cycling cells in the live limbal niche.
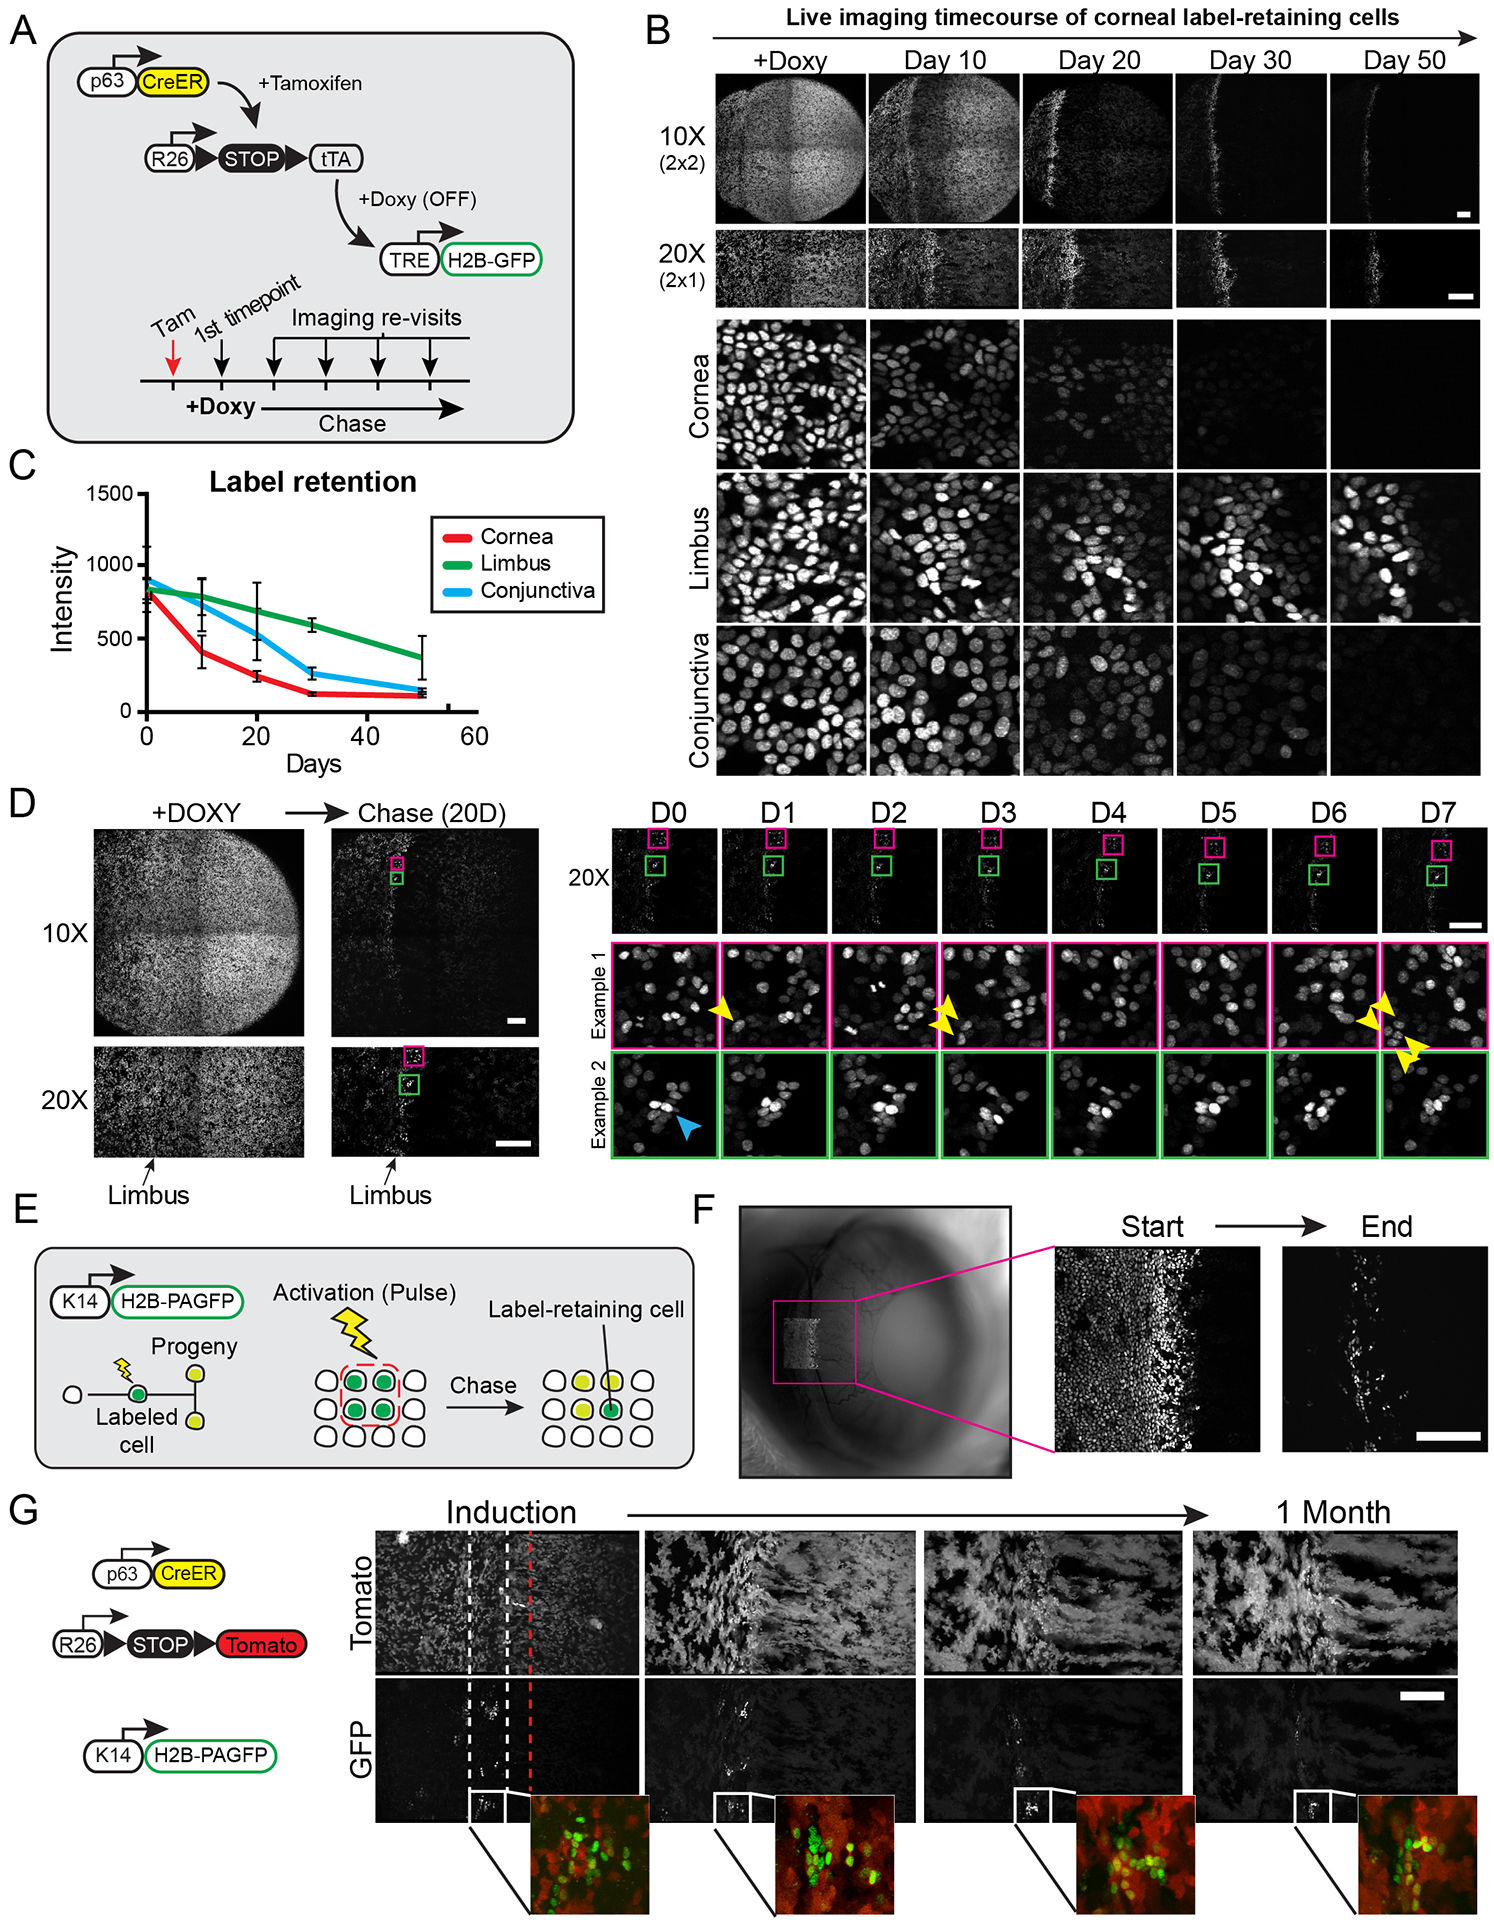
(A) Experimental strategy and genetic alleles used to visualize slow-cycling, label-retaining cells in the anterior ocular epithelium. Tamoxifen induces the uniform expression of the H2B-GFP fusion reporter in all basal cells. Addition of Doxycycline to the diet suppresses the expression of the reporter that is subsequently diluted among daughter cells after each cell division. (B) Global and high-magnification views of the eye imaged at the indicated time points following the addition of Doxycycline. (C) Quantification of label retention in cells within the indicated epithelial compartments (n = 15 sampled images per time point from 2 mice, p < 0.001; 2-way ANOVA). (D) Examples capturing the activity of slow-cycling limbal cells in real time by live imaging. Label-retaining cells in the limbus are imaged at single-cell resolution after a 20-day chase period, and the same cells are re-imaged at daily intervals. Yellow arrows show a label-retaining cell undergoing two symmetric cell divisions. The cyan arrow indicates a cell that remains quiescent during the entire time course. Also see Movie S5. (E) Experimental strategy and genetic alleles to visualize label-retaining cells in the limbus using an in vivo photo-activatable reporter. H2B-PAGFP expressing cells in the limbal area are marked by photo-activation and the same cells are re-imaged after a chase period. (F) Low magnification, widefield fluorescent image of the eye immediately after photo-labeling cells in the limbal area (left panel). High magnification views of the same photo-labeled cells at the beginning and end of the chase period acquired by 2-photon live imaging (right panels). (G) Representative images of the limbal area taken at weekly intervals after Tamoxifen induction. Prior to induction, cells in the limbus were photo-labeled and chased to reveal label-retaining cells. Dotted lines indicate the margins of the outer (white) and inner (red) limbus. Panels B, D, F and G show tiled images of the cornea and limbus constructed from multiple fields-of-view. Scale bars: 200 μm.