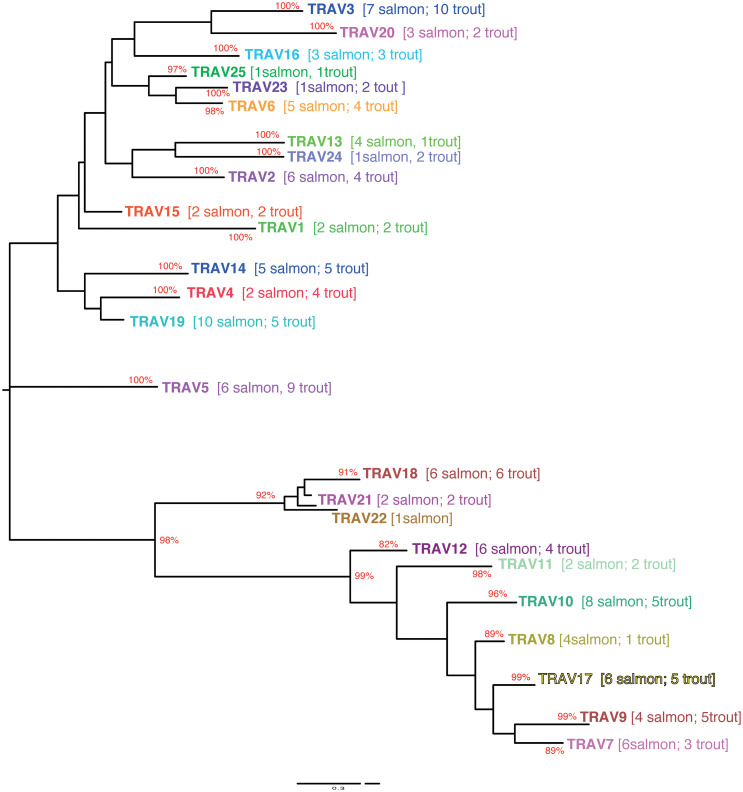
Figure 3.
Evolutionary tree of TRAV protein sequences from Atlantic salmon and rainbow trout. The tree was inferred using the Maximum Likelyhood method and JTT matrix based model. A boostrap of 500 replicates was used. The tree with highest likelihood is shown, and is drawn to scale, with branch lengths representing the number of substitutions per site. The percentage of trees in which the associated taxa cluster together is indicated when >80. Subgroups have been collapsed for the sake of readability. The number of Atlantic salmon and rainbow trout sequences in each subgroup is indicated between brackets (an extended tree is represented in Supplementary Figure 4 ). The analysis has been performed only on functional V sequences. Hence it comprises only 25 subgroups since subgroup 26 is only represented by an ORF sequence in the Arlee rainbow trout genome.

